Anti-fiat gold prices climbed over the past 24 hours following Wednesday’s FOMC monetary policy announcement. The central bank left benchmark lending rates and the pace of quantitative easing unchanged, as widely expected. The details of the statement, as well as Chair Jerome Powell’s press conference, depressed the US Dollar and Treasury yields.
When both the latter are falling, it tends to bode well for XAU/USD given that it is a non-yielding asset. There was a kneejerk reaction to the Fed. Markets were initially spooked by the statement as the central bank noted that the economy made progress to its maximum employment and price stability goals. Policymakers noted that they are closer to tapering.
However, the mood quickly reversed course as it soon became clear that the central bank is still quite dovish. Powell said that the labor market is ‘some ways off’ before reaching substantial further progress. He reiterated that inflation is transitory. Treasury yields quickly turned lower as his commentary likely suggested that tapering is still not quite around the corner just yet, opening the door to optimal stock market conditions.
The first estimate of US second-quarter GDP is due over the coming 24 hours. Annualized growth is expected at 8.5% q/q from 6.4% prior. Atlanta’s Fed GDPNow Q2 real growth estimate has been notably trending lower since April, currently standing at 6.4%. A softer-than-expected outcome could underscore the central bank’s hesitation. If such a result depresses bond yields further, gold could continue benefiting.
Gold Technical Analysis
Gold prices may be readying to extend recent gains after prices recently pierced a near-term falling trendline from earlier this month on the 4-hour chart below. This also follows positive RSI divergence, showing that downside momentum was fading. Extending gains may see prices aim for the July 15th high at 1834. That would also leave XAU/USD back above the 200-period Simple Moving Average.
The greenback kept falling and reached fresh weekly lows against most major rivals, asUS data missed the market’s expectations. Q2 Gross Domestic Product showed the economy grew at an annualized pace of 6.5%, better than the previous 6.4%, although missing the 8.6% expected. Also, Initial Jobless Claims for the week ended July 23 printed at 400K, worse than anticipated.
EUR/USD trades near 1.1900 while GBP/USD approaches the 1.4000 figure. The Canadian dollar also reached fresh highs against the greenback, but AUD/USD is stuck around 0.7400 as demand for the aussie remains scarce.
The Japanese yen appreciated on the back of a better market’s mood, with USD/JPY trading around 109.40.
Spot gold jumped to $1,832.62 a troy ounce, its highest in two weeks, while crude oil prices also reached fresh highs, with WTI ending the day at $77.50 a barrel.
Wall Street closed in the green, still underpinned by relief after the Fed hint at no rush to taper. US government bond yields ticked higher.
Update: Gold (XAU/USD) prints the heaviest daily gain in 11 weeks, despite recently easing from the monthly top, by the end of Thursday’s North American trading session. That said, the yellow metal jumped to $1,832.70 before stepping back near $1,828.50 by the press time.
Strong gains of the gold prices could be linked to the US dollar’s performance and a broad optimism in the market.
The US Dollar Index (DXY) dropped to a one-month low, posting a four-day losing streak, before closing around 91.91 with 0.39% daily losses. In doing so, the greenback gauge ignores the three basis points (bps) of an upside by the US 10-year Treasury yields to 1.266%. On the same line, the Wall Street benchmarks also posted mild gains by the end of the day’s trading.
After the Fed’s resistance to discuss tapering, downbeat US Gross Domestic Product (GDP) figures for Q2 and other US data justified the need for tapering and propelled market sentiment. The preliminary reading of the US Q2 GDP dropped below 8.4% expected to 6.5%, versus 6.4%, quarterly while the Pending Home Sales for June eased and weekly Jobless Claims also jumped.
Other than the data, chatters over US President Joe Biden’s infrastructure spending also favored the market’s mood.
Moving on, gold’s further upside hinges on its break of the $1,835 monthly high, as it has already crossed the 200-DMA level of $1,821, before reaching the $1,845 hurdle.
End of the US session wrap.
After closing in the positive territory on Wednesday, gold preserved its bullish momentum and reached its highest level in two weeks at $1,832 before going into a consolidation phase. As of writing, the XAU/USD pair was up 1.35% on a daily basis at $1,831.
On Wednesday, the greenback came under strong bearish pressure after FOMC Chairman Jerome Powell adopted a patient tone regarding the beginning of asset tapering. Although Powell acknowledged that inflation was currently above desired levels, he reiterated that temporary factors were behind rising price pressures. Reflecting the broad-based USD weakness, the US Dollar Index (DXY) closed the third straight day in the negative territory.
During the first half of the day on Thursday, the USD struggled to find demand and the disappointing macroeconomic data releases caused the currency to continue to weaken in the American session.
The US Bureau of Economic Analysis announced that the US economy grew at an annualized rate of 6.5% (first estimate) in the second quarter. This reading followed the 6.4% expansion recorded in the first quarter and came in worse than the market expectation of 8.5%. Other data from the US revealed that there were 400,000 Initial Jobless Claims in the week ending July 24, compared to analysts' estimate of 380,000. Finally, the US National Association of Realtors reported that Pending Home Sales declined by 1.9% in June. Currently, the DXY is trading at its lowest level in a month at 91.90, losing 0.4% on the day.
On Friday, the Personal Consumption Expenditures (PCE) Price Index, the Fed's preferred gauge of inflation, will be looked upon for fresh impetus. The Core PCE Price Index is expected to rise to 3.7% on a yearly basis from 3.4% in May. A stronger-than-expected reading could help the USD limit its losses but the Fed seems certain that inflation will come back down eventually and the market reaction is likely to remain short-lived.
Gold technical outlook
On the daily chart, the Relative Strength Index (RSI) indicator rose to 60 on Thursday, suggesting that the bullish momentum is still intact and there is more room on the upside before XAU/USD become technically overbought. Additionally, gold looks to close above the 200-day SMA for the first time since mid-June, confirming the bullish bias.
On the upside, the initial resistance is located at $1,834 (July 15 high) ahead of $1,845 (May 10 high) and $1,860 (Fibonacci 23.6% retracement of April-June uptrend).
Supports, on the other hand, are located at $1,830 (50-day SMA), $1,820 (200-day SMA) and $1,800 (psychological level, 100-day SMA and Fibonacci 50% retracement).
GBP/JPY steps back from 13-day top, under pressure of late.
UK, EU warned over NI protocol deadlock even as policymakers brace for further talks.
UK’s daily infections rise for second day but weekly count falls 22%, Japan braces to take more prefectures under emergency.
GBP/JPY justifies the previous day’s Doji candlestick formation with a pullback to 152.85 ahead of Friday’s Tokyo open.
The cross-currency pair jumped to the highest since July 13 on Thursday after Brexit optimism and weaker yen favored bulls. However, fresh chatters over Brexit and coronavirus tames the prior risk-on mood.
“The UK and EU have both taken a ‘fundamentally flawed’ approach to the Northern Ireland Protocol, a House of Lords committee has concluded,” said the BBC. Before that, the British and European Union (EU) policymakers were optimistic over holding further negotiations to tackle the Northern Ireland (NI) protocol issue.
Elsewhere, Britain’s 31,117 daily coronavirus cases mark the second day of increase but fall 22% during the last seven days. Alternatively, Japan’s covid numbers cross the 10,000 mark for the first time and push the policymakers to re-think emergencies in more prefectures. Japan’s Kyodo News quotes anonymous government sources in this regard while saying, “The government is planning to add three prefectures neighboring Tokyo, as well as Osaka Prefecture, to areas under the COVID-19 state of emergency amid a resurgence of the coronavirus.”
On a different page, downbeat US data backed the market’s hope for further stimulus, favoring the risk-on mood. Also backing the optimism is the current talks over US President Joe Biden’s infrastructure spending plan in the American Senate.
Amid these lays, S&P 500 Futures drop 0.35% after rising around half a percent to refresh the record top on Wall Street.
Looking forward, Japan’s preliminary reading of June’s Industrial Production and Retail Sales for May can entertain the pair traders. However, qualitative catalysts are more important for fresh direction, likely towards the south.
Technical analysis
A Doji on the daily chart below 50-DMA, near 153.55, suggests further pullback of GBP/JPY. However, 100-DMA tests intraday sellers around 52.60.
The EUR/USD is rising for the fifth consecutive day on Thursday, boosted by a decline of the US dollar across the board. It is trading at 1.1890, at the highest level since July 6, on its way to the best week in three months.
During the American session, the US dollar dropped, further supporting the upside in EUR/USD. Economic data from the US contributed to the decline. Growth during the second quarter came in at 6.5%, below the 8.5% expected; initial jobless claims fell to 400K, a reading worse than consensus; and pending home sales declined 1.9% in June against expectations of a modest increase.
Economic figures added fuel to the slide of the greenback that started on Wednesday following the FOMC meeting. The DXY is down by 0.41%, at 91.90, the lowest level in a month. At the same time, US yields are hovering around recent levels. Equity prices are up in Wall Street. The Dow Jones gains 0.55% and the Nasdaq 0.45%. The risk-on environment weighs on the dollar.
The EUR/USD is looking at the 1.1900 area. Currently is testing the 1.1890 resistance area and a break higher should lead to further gains above 1.1900. The next resistance stands at 1.1920/25. The positive tone is likely to remain intact while above 1.1840; the next support is the 20-day moving average at 1.1820.
Nexus is a model for connecting multiple national payment systems into a cross-border platform that could enable international payments to happen as quickly as sending a text message.
The Bank for International Settlements (BIS) has partnered with the Monetary Authority of Singapore, the country’s financial supervisory authority, to publish a blueprint for the multilateral linking of domestic real-time payment systems across borders.
Building on the bilateral linkage between Singapore’s PayNow and Thailand’s PromptPay launched in April 2021, the blueprint also leverages the experience of the National Payments Corporation of India’s (NPCI) development and operation of the Unified Payments Interface (UPI) system.
The blueprint is titled Project Nexus (link to .pdf) and envisages the creation of ‘Nexus Gateways’ that serve to coordinate compliance, foreign exchange conversion, message translation, and the sequencing of payments among all participants.
An overarching Nexus Scheme sets out the governance framework and rulebook for participating retail payment systems, banks, and payment service providers to coordinate and effect cross-border payments through the network.
Benoît Cœuré, head of the BIS Innovation Hub, commented: “Project Nexus is trying to achieve the equivalent of internet protocols for payments systems. That means creating a model through which any country can join by adopting certain technical and governance requirements.”
Project Nexus requires participating countries to adopt the protocols once to gain access to the broader cross-border payments network. Countries won’t have to negotiate payment linkages with each jurisdiction on a bilateral basis.
Andrew McCormack, head of the BIS Innovation Hub Singapore Centre, said: “Country-to-country and regional payment connections already exist. But they require significant coordination efforts, which increase exponentially with more participants. Three countries require three bilateral links but 20 countries would require 190 bilateral links.”
Nexus is a model for connecting multiple national payment systems into a cross-border platform that could enable international payments to happen as quickly as sending a text message, the Bank for International Settlements announced.
BIS proposes to connect national systems internationally to improve speed, cost, and transparency of cross-border payments, which basically sums up the mission of blockchain firms such as XRP-powered Ripple, ex-Ripple founder Jed McCaleb’s Stellar (XLM), and newly launched Algorand-powered Six Clovers.
SWIFT has just announced cross-border payments in a matter of seconds with its new messaging product SWIFT Go, which is complementary to cross-border settlement services such as BIS’ Project Nexus and Ripple’s On-Demand Liquidity.
The news further proves the utility of the XRP Ledger in a turbulent period for Ripple Labs due to the ongoing lawsuit with the SEC, which claims XRP to be a security for its “decentralized nature“.
The same Commissioner has released a public statement together with SEC Commissioner Elad Roisman – “a gift from the heavens” – admitting to the lack of clarity within the digital asset space, further contributing to Ripple’s claim that it had no fair notice that XRP could be deemed a security.
In June, BIS opened an Innovation Hub in London to push for digital currencies. Later that month, the institution praised CBDCs against Bitcoin, while adding that stablecoins are no game-changer as they have the potential to fragment the liquidity of the monetary system.
The dollar extends the bearish move and drops to session lows around 92.50 when tracked by the US Dollar Index (DXY).
US Dollar Index recedes from recent peaks
The index gives away further ground and recedes to the mid-92.00s on the back of the extra improvement in the risk complex.
Yields of the key US 10-year reference also edge lower after briefly testing the area above 1.30% and collaborate with the renewed downside momentum in DXY.
Further selling pressure hit the dollar after the ECB meeting left the key rates unchanged, as expected, and both the Governing Council and Chairwoman Lagarde at her press conference did not sound as dovish as expected.
The docket was not supportive of the buck either after weekly Claims rose by 419K (from 368K) and the Chicago Fed National Activity Index eased to 0.09 in June (from 0.26). Later in the session, Existing Home Sales and the CB’s Leading Index will close the daily calendar.
US Dollar Index relevant levels
Now, the index is losing 0.27% at 92.52 and faces the next support at 92.46 (23.6% Fibo of the November-January rally) followed by 92.00 (monthly low Jul.6) and then 91.51 (weekly low Jun.23). On the upside, a break above 93.19 (monthly high Jul.21) would open the door to 93.43 (2021 high Mar.21) and finally 94.00 (round level).
Information on these pages contains forward-looking statements that involve risks and uncertainties. Markets and instruments profiled
“Make no mistake: It doesn’t matter whether it’s a stock token, a stable value token backed by securities, or any other virtual product that provides synthetic exposure to underlying securities.”
Gary Gensler, Chair of the Securities and Exchange Commission, spoke about security-based swaps before the American Bar Association Derivatives and Futures Law Committee.
He started off by noting that “I’m not speaking on behalf of my fellow Commissioners or the SEC staff”. This short sentence is now vital as the agency prepares to face the deposition of ex-SEC Director William Hinman for a speech he gave about the nature of Ether – “not a security” – in 2018.
At the end of the speech, Mr. Gensler mentioned the intersection of security-based swaps and financial technology, including with respect to crypto assets.
“There are initiatives by a number of platforms to offer crypto tokens or other products that are priced off of the value of securities and operate like derivatives”, said the SEC Chair.
“Make no mistake: It doesn’t matter whether it’s a stock token, a stable value token backed by securities, or any other virtual product that provides synthetic exposure to underlying securities. These platforms — whether in the decentralized or centralized finance space — are implicated by the securities laws and must work within our securities regime.
“If these products are security-based swaps, the other rules I’ve mentioned earlier, such as the trade reporting rules, will apply to them. Then, any offer or sale to retail participants must be registered under the Securities Act of 1933 and effected on a national securities exchange”, he added.
The SEC has already filed complaints against retail offerings of security-based swaps and is likely to charge more blockchain firms in the near future.
FinanceFeeds has recently covered the phenomenon of tokenization of assets and named Binance as one of the leading firms already offering such products, having started with a tokenized version of the Tesla stock (TSLA) as the operator aims to allow non-U.S. based users to trade the instrument and many more after that.
Binance, among a growing number of firms, could be meaning to bypass the regulatory framework in the United States and other jurisdictions. The counterreaction is what we’re seeing today: a global crackdown on Binance.
Ripple is also venturing into asset tokenization utilizing its renowned XRP Ledger, RippleNet’s General Manager Asheesh Birla announced earlier this month.
“Tokenization is transforming how people buy, sell, track and manage assets – everything from art and real estate to intellectual property, equities, and supply chain goods. In fact, the World Economic Forum projects 10% of the world’s GDP will be tokenized by 2027”.
“We’re expanding from a cross-border payments network to a platform providing tokenized services that will bring crypto capabilities to the enterprise and prepare them for a future where crypto is front and center. RippleNet was initially built to solve the challenges with speed, cost, and transparency in cross-border payments for those that have been grossly underserved by the financial system at large.”
The Asia Pacific’s progressive crypto regulation is probably where Ripple will find momentum for its new product, but there is no lack of clarity in regard to blockchain-powered products that provide exposure to underlying securities: they are implicated by the US securities laws. SEC Chair Gary Gensler made that abundantly clear.
Lack of clarity has been a very serious issue within the crypto ecosystem in the United States. So much so that this week, SEC Commissioners Hester Peirce and Elad Roisman have made public statements that admit to that – “a gift from the heavens“, said attorney Jeremy Hogan.
The bombshell comes in good timing for the Ripple counsel, who will have ex-SEC Director William Hinman depose on July 27 in order to further strengthen its fair notice defense.
The following day, July 28, is the deadline for the requested response from SEC Chair Gary Gensler to Senator Elizabeth Warren. She has requested information about the regulator’s “authority to properly regulate cryptocurrency exchanges and to determine if Congress needs to act to ensure that the SEC has the proper authority to close existing gaps in regulation”.
The current price offers little improvement on where Bitcoin started the year.
Bitcoin has fallen below $30,000 for the first time in almost a month.
Tuesday’s painful 24-hour losses of 5.4% have contributed to a seven-day decline of 10.5% — and as is normally the case, the sell-offs are even worse among altcoins.
BTC’s decline may be linked to Grayscale Bitcoin Trust unlocking a large chunk of shares over the weekend, giving investors their first chance to sell in six months.
Its current performance is little improvement on the price of $29,032 that was seen on Jan. 1.
Other factors that haven’t been helping matters related to the fact that on-chain activity has remained “extremely muted” in the past week, according to Glassnode.
Its latest report suggests “Bitcoin block space and on-chain settlement is low, mined blocks are not full, and the utilization of the network is relatively low.”
Whereas the BTC network was settling daily volumes of $15.5 billion when activity peaked in May 2021, this has fallen to just $5.3 billion a day at present.
To make matters worse, most of this transaction volume relates to coins that are being sold at a loss, with median losses currently working out at about $353 million per day.
Elon Musk to Attend Bitcoin Conference
In other developments, it has been confirmed that Elon Musk is going to discuss Bitcoin with Jack Dorsey at a conference on Wednesday — something that could give the markets a little something to cheer about.
“The B Word” is an online panel that has been organized by the Crypto Council for Innovation, and other attendees will include Cathie Wood and Adam Back.
July 20th, 2021 — We are pleased to announce that DOGE is listed on GokuMarket exchange for BTC, USDT, & EUR trading. GokuMarket is known as the one marketplace for the blockchain economy. GokuMarket provides real-world crypto utilities to their users; buy, sell, earn and shop with cryptocurrencies on GokuMarket using the web or Android / iOS app
Users can now trade Dogecoin (DOGE) effortlessly on GokuMarket. Dogecoin has been a long-standing token in the cryptocurrency community and has withstood the test of time regarding volume and adoption. For this reason, we have chosen to list the fan favorites for our trading community. More DOGE utilities will come soon.
Deposit & withdraw Dogecoin (DOGE) on GokuMarket with ease on one of the safest & leading desktop & mobile wallets. GokuMarket multi-currency wallet is very user-friendly and accessible on the go.
👉 Trade Dogecoin (DOGE) with BTC, USDT & EUR 📈
The GokuMarket cryptocurrency market is constantly expanding and offering many opportunities to online traders. Dogecoin (DOGE) is now listed on the GokuMarket Exchange with the BTC, USDT & EUR trading pairs, which can be accessed from the GokuMarket Android / iOS app or the website.
The GokuMarket community keeps growing stronger and stronger from the new exchange and marketplace crypto project listings. Once listed, the crypto projects can add more real-world use cases for their users on GokuMarket. So if you know of any exciting projects, please ask them to explore and complete the listing application.
Welcome Dogecoin (DOGE) Community 💜
About Dogecoin (DOGE)
Dogecoin (DOGE) was originally created at least in part as a lighthearted joke for crypto enthusiasts, and took its name from a once-popular meme. The open-source digital currency was created by Billy Markus from Portland, Oregon, and Jackson Palmer from Sydney, Australia, and was forked from Litecoin in December 2013. Dogecoin’s creators envisaged it as a fun, light-hearted cryptocurrency that would have greater appeal beyond the core Bitcoin audience. DOGE was created to support content creators, online communities and artists. In recent times, DOGE has seen a massive adoption and support. Tesla CEO Elon Musk posted several tweets on social media that Dogecoin is his favorite coin.
About GokuMarket
GokuMarket is a European-licensed crypto wallet, exchange, and marketplace that offers retail cryptocurrency investors and seasoned traders solutions. The platform operates globally, with its primary markets being Poland, Czech Republic, France, Scandinavia, the United Kingdom, Thailand, Japan, Vietnam, Ecuador & Colombia.
Gold price is extending its corrective downside on Monday, reversing half the previous week’s gains, as the safe-haven demand for the US dollar remains unabated amid broad risk-aversion. Investors fret about the escalating Delta coronavirus variant cases globally and its impact on the pace of the economic recovery. Markets are in a ‘sell everything mode’ and seem to trust only the ultimate reserve currency, the US dollar, in times of panic and uncertainty. Meanwhile, mixed US Retail Sales and Consumer Sentiment data spurred inflation risks on growth, as the Fed prepares for monetary policy normalization.
lack of healthy support levels.
Gold Price: Key levels to watch
The Technical Confluences Detector shows that gold price has taken out all the key support levels, as the sell-off resumes towards a minor cap at SMA100 four-hour of $1796.
Further south, powerful support at $1792 will test the bearish commitments. That level is the confluence of the SMA100 one-day, pivot point one-week S1 and the previous week low.
The last line of defense for gold bulls is seen at the Fibonacci 23.6% one-month at $1790.
On the flip side, immediate resistance is aligned around $1809, where the SMA10 one-day, Fibonacci 61.8% one-week and the previous day low converge.
Gold buyers need to find a strong foothold above $1813 to unleash further recovery gains. At that point, SMA50 four-hour, SMA200 one-hour and Bollinger Band one-hour Middle merge.
Up next the bulls will target the intersection of the Fibonacci 38.2% one-week and Fibonacci 23.6% one-day at $1815.
Here is how it looks on the tool
About Technical Confluences Detector
The TCD (Technical Confluences Detector) is a tool to locate and point out those price levels where there is a congestion of indicators, moving averages, Fibonacci levels, Pivot Points, etc. If you are a short-term trader, you will find entry points for counter-trend strategies and hunt a few points at a time. If you are a medium-to-long-term trader, this tool will allow you to know in advance the price levels where a medium-to-long-term trend may stop and rest, where to unwind positions, or where to increase your position size.
Information on these pages contains forward-looking statements that involve risks and uncertainties. Markets and instruments profiled
Sygnum Bank, which offers digital and regulated banking for DeFi assets and tokens, has announced that it has partnered with Artemundi to tokenized Picasso’s Fillete Au béret painting.
This is a radical new addition to the blockchain ecosystem with the introduction of what is called Art Security Tokens (ASTs) which are tokens that can be purchased and traded like shares and they mark ownership to artwork and it is broadcast onto the blockchain. This works differently from NFTs in this way and it remains to be seen whether ASTs and NFTs can co-exist in the blockchain artwork industry.
Mathias Imbach, Co-Founder and Group CEO of Sygnum Bank, says, “It has been Sygnum’s mission from the start to empower investors with more direct access to ownership and value. The tokenization of the Fillette au béret exemplifies how we bring our mission to reality, unlocking a universe of unique investment opportunities that can be made accessible to many.”
The painting is valued at 4 million banks and retail and institutional investors would be able to buy ownership of the painting by subscribing to the tokens exclusively through the Sygnum Bank through its e-banking platform and the minimum subscription is 5000 francs. The tokens can be traded on SygnEx which is a digital exchange launched by the bank and the bank also have a CHF stablecoin which can be used for the purchase of the tokens.
The bank believes that the tokenization of the artwork on the blockchain would help to open up the artwork market to a much larger network of users and democratize the whole process. This would also help to connect the buyers and sellers directly without the need for intermediaries and this would help to save costs as well.
This development marks an interesting period for the artwork market which has been an exclusive domain of large investors for many decades. It was ripe for being opened up so that more users would be able to gain access to precious artwork but the fact that blockchain has been the medium that has made it possible would be a surprise to many. Blockchain was connected to the finance industry a lot more than the artwork industry and it is indeed an innovative approach to tokenize the artwork industry and make it accessible for all and the fact that it is being done by a FINMA regulated financial institution would only help to bring in more trust into this new approach.
On Friday, both parties announced they made progress in regard to the privilege issues and planned to further narrow and resolve those issues relating to Mr. Hinman’s deposition.
With one week to go before the deposition of William Hinman takes place, the plaintiff and defendants have jointly sent a letter to Judge Sarah Netburn announcing they have reached a deal so that the testimony goes smoothly.
“We have reached an understanding, reflecting a compromise by all parties, pursuant to which the Defendants may examine Mr. Hinman on various issues without triggering a privilege objection from the SEC”.
Last week, the Judge ordered the deposition to go forward despite the immense resistance from the SEC – “desperate”, according to attorney Jeremy Hogan.
On Friday, both parties announced they made progress in regard to the privilege issues and planned to further narrow and resolve the issues relating to Mr. Hinman’s deposition.
Despite the understanding reached between the SEC and Ripple, some remain skeptical about the progress made. “I will be surprised if the parties do not come to her after the deposition to get a ruling on the privilege “deliberative process” issue”, said XRP Holders’ attorney John Deaton.
“They may have agreed to ask certain questions and allow him to answer those questions under seal and then get a ruling after the fact”.
Deaton has previously suggested ten basic questions for the deposition that don’t fall under the privilege argument, but a Special Master may still be required to rule on the potential stream of objections.
At the center of the deposition of the ex-SEC Director of Corporation Finance will be his speech in 2018 about Ether as he said it is not to be considered a security. That triggered an intense market reaction and many deals were made at the time and after that, but also many questions have arisen.
Ripple Labs intends to raise some of those questions, in a move that could both expose the SEC for its missteps and put pressure on ETH as its nature as a non-security could be revisited.
Despite an empty docket to start this week, markets opened to a broad and intense risk aversion with motivation coming as an after thought
The S&P 500 broke trendline support and the Dow suffered its worst day in 8 months, but potential arises from the breadth of the risk aversion
While the Delta variant, growth and monetary policy were all in headlines; risk aversion seemed to be the root of the market’s move
An Unexpected Fire In US Equities
If we were going by the economic calendar, it was looking like we were heading into the full lull of the summer doldrums. What we have seen thus far could not be further from those expectations. A strong downdraft in some of the most closely watched risk assets proved not simply an isolated bout of volatility. The risk aversion proved broad for both region and asset type which goes a long way to raising the threat that this was not simply a short-lived shudder from a thinned market. All traders should be on high alert, but there is strong precedence recently to maintain a sense of skepticism given a host of false starts across the financial system over these past months. It is difficult to override an undercurrent of illiquidity and upend a deep complacency born out of borrowed time and massive stimulus programs. As such, I’m eying the S&P 500’s first break of trendline support stretching back to the post-pandemic recovery and the Dow’s biggest daily drop since October for evidence that momentum is shifting to full panic-led deleveraging.
Chart of the S&P 500 with 20 and 100-Day Moving Avgs and Gaps (Daily)
One of the more reliable measures for carrying forward a systemic sentiment shift is to establish a fundamental root to the move. Event risk in the opening 48 hour of this week (Monday behind us and Tuesday ahead) is particularly light and doesn’t get close to hitting the nerve of the more effective themes that have driven the market lately. A growing reference in headlines and in trader circles is the reference to the rising numbers of coronavirus cases in countries like the US that are reopening as the Delta variant spreads. Alternatively, the slowing in growth trends seen in recent data points (and perhaps with Friday’s PMIs) could give weight to the breakdown in crude oil and the US 10-year Treasury yield. Or, perhaps the recognition of a global shift in monetary policy towards normalizing from an extremely easy path is finally catching up to speculators after weeks of building evidence? It is all possible, but I believe this is more of a risk-first move with explanation coming later. This could prove the most capable universal motivation for markets, but it could also snuff out a nascent trend should liquidity dry up quickly.
Chart of Crude Oil Active Futures Price with Volume, 20 and 100-SMA and 1-Day Change (Daily)
Visualized another way, the below intensity curve helps me better assess the standings of conviction. When risk trends take command of investors the world over, it can be difficult the momentum that results. However, getting that traction in the first place can prove quite the feat. While there was some moderate risk aversion to end this past week, the truly comprehensive move didn’t register until Monday. After correlation and intensity, follow through is the most important feature of a productive trend. At what point does one call a trend? That’s up for discretion, but at a minimum I would look for a second day’s follow through.
Chart of S&P 500 Overlaid with Aggregate of Major Central Banks’ Stimulus (Monthly)
Chart Created by John Kicklighter with Data from Central Banks
The Dollar’s Bullish Break Doesn’t Register as an ‘Extreme’ Haven Demand
While much of the interest through the opening session of the week may have gone to indices and other overt risk measures, I was also keeping an eye on assets that orient more towards the haven side. In particular, the FX market’s Dollar and Yen crosses were of particular interest. For the Yen pairs, there was a broad enough slide (the Japanese currency rising) that it would also pull down USDJPY. That is a combination of two generic havens, but the Greenback usually appeals in more extreme scenarios. If we were to look at the Dollar by itself, the DXY trade-weighted index struggled to push higher. That said, it is heavily weighted towards EURUSD, a pair that is rooted more in its liquidity rather than its ‘risk’ contrast. If there is a second day of risk aversion, however, the smallest 10-day range in 18 months is likely to provide a critical break.
Chart of the EURUSD with 20 and 100-SMA and 10-Day Historical Range (Daily)
Elsewhere, managed to produce some impressive bullish breakouts against key counterparts. GBPUSD isn’t particularly known for its contrast on the risk spectrum, but it seemed tuned to the day’s volatility. A break of 1.3700 has brought the pair to a six month low by way of a prominent trendline support breakdown and subsequent clearance of the 200-day moving average – the first slip below this measure in 257 trading days.
Chart of the GBPUSD with 100 and 200-Day Moving Average (Daily)
Another incredibly impressive break in the Dollar’s favor came from USDCAD. Already measuring out progress – like the AUDUSD’s head-and-shoulders break a month ago – the ‘Loonie’ cross similarly cleared its own 200-day moving average over a similar time frame as well as the historical midpoint for the pair at 1.2600. For scale this is perhaps the most impressive clearance. Yet, for it to truly matter, there needs to be follow through. A break alone, even one as steeped in technical renown as this, is no guarantee of trend.
Chart of the USDCAD with 100 and 200-Day Moving Average and 1-Day Rate of Change (Daily)
The Breakdown is written, produced by and features NLW, with editing by Rob Mitchell and additional production support by Eleanor Pahl. Adam B. Levine is our executive producer and our theme music is “Countdown” by Neon Beach. The music you heard today behind our sponsor is “Razor Red” by Sam Barsh. Image credit: hamzaturkkol/iStock/Getty Images Plus, modified by CoinDesk.
Hawkish comments from BOE members keep GBP supported
GBP/USD struggles to keep hold as EUR/GBP looks to break out of descending channel
Despite a tough week for GBP/USD the Pound remains supported by expectations of a more hawkish Bank of England. The lead-up to the August MPC meeting is drawing more attention as markets increase odds that the BOE will start amending its monetary policy to adapt better to current economic conditions.
Michael Saunders was the focus point on Thursday when he mentioned that inflation could prove to be stubbornly high in the coming months, hinting at the possibility of an interest rate in the first half of 2022. Prior to that, Ramsden had made a similar argument regarding the rapid developments since the last forecast was published in May, which had allowed for considerations of tapering sooner than originally expected.
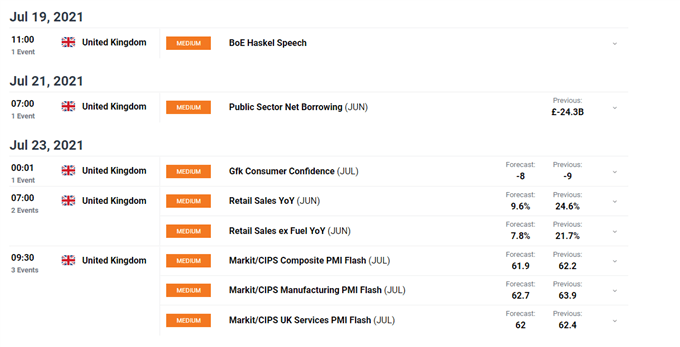
Looking ahead at the UK calendar for next week, we’ll have another BOE member speaking on Monday (Haskel) and then little else until the June retail sales and PMIs are published on Friday.
Despite a tough week for GBP/USD the Pound remains supported by expectations of a more hawkish Bank of England. The lead-up to the August MPC meeting is drawing more attention as markets increase odds that the BOE will start amending its monetary policy to adapt better to current economic conditions.
Michael Saunders was the focus point on Thursday when he mentioned that inflation could prove to be stubbornly high in the coming months, hinting at the possibility of an interest rate in the first half of 2022. Prior to that, Ramsden had made a similar argument regarding the rapid developments since the last forecast was published in May, which had allowed for considerations of tapering sooner than originally expected.
Looking ahead at the UK calendar for next week, we’ll have another BOE member speaking on Monday (Haskel) and then little else until the June retail sales and PMIs are published on Friday.
UK ECONOMIC CALENDAR PROVIDED BY DAILYFX
Looking at GBP crosses, GBP/USD is threatening to break below 1.30 if the pair is unable to hold above its 200-DMA (1.3808) going into the new week. The Stochastic is showing a slightly negative bias in the short term but there is still room for a swing upwards towards 1.39, which is proving to be a tough resistance to crack. For EUR/GBP the pressure continues to be tilted to the downside as the pair was nearing the 0.85 mark earlier on in the week as it attempts to consolidate and break out of the descending channel it has been trading in for the last 3 months. A break below this area is likely to lead to a new attempt at breaking below the yearly low seen in April at 0.8472.
Binance has been warned by regulators in the country it is based, the Securities and Futures Commission (SFC) of Hong Kong, to stop providing “stock tokens” services.
“SFC wishes to make it clear that no entity in the Binance group is licensed or registered to conduct ‘regulated activity’ in Hong Kong,” they say.
Binance quickly complied, stating “we are announcing that we will be winding down support for stock tokens on Binance.com to shift our commercial focus to other product offerings. Effective immediately, stock tokens are unavailable for purchase on Binance.com, and Binance.com will no longer support any stock tokens after 2021-10-14 19:55 (UTC).”
They have a partnership with CM-Equity AG, a licensed investment firm in Germany, and say they may move Europeans there.
“Users may transition their stock token balances to CM-Equity AG once its new portal is established,” Binance said.
This is the latest regulatory action against the global crypto exchange based in Hong Kong which has been under the scrutiny of US authorities.
They were founded in an Initial Coin Offering (ICO) in 2017 which gave rise to both Binance the exchange and the BNB token now operating in the Binance Chain.
Their initial base in Japan faced regulatory difficulties as FSA there did not license them. So they moved to Malta, but a change of administration led to the Maltese authorities clarifying that “Binance is not authorised by the MFSA to operate in the crypto currency sphere.”
Since then speculation has intensified regarding their headquarters with Binance putting their HQ on Linkedin as “everywhere.”
Changpeng Zhao, Binance’s CEO, has refused to state in interviews where they are based, giving rise to rumors that Cayman Island is their HQ or Seychelles.
The Cayman Islands financial authority (CIMA) also said earlier this month Binance does not have a license there and they are investigating “whether Binance, the Binance Group, Binance Holdings Limited or other companies affiliated with this group of companies have activities operating on or from within the Cayman Islands that may fall within the scope of the Authority’s regulatory oversight.”
Binance’s own terms and conditions, however, have Hong Kong as its jurisdiction, stating:
“These Terms (including this arbitration agreement) shall be governed by, and construed in accordance with, the laws of Hong Kong.”
Hence Binance.com itself now has to comply with whatever Hong Kong authorities say, while previously actions from UK’s FCA and other jurisdictions had as response something akin to: a subsidiary operates there and thus Binance.com is not affected, we’ll just launch binance.[country].
That’s unless Binance moves again, with the exchange operating in somewhat of a gray zone as it was publicly funded from the get go, unlike Coinbase which was privately funded and opened to the public only after it reached a valuation of $100 billion.
The global public, by having the choice to invest in Binance from the get go, has greatly benefited from the success of the exchange. While the public has not benefited at all from the success of Coinbase as they were prohibited from investing in it for the first nine years of its existence when it saw massive growth.
Something the United States regulators do not like as such US prohibition in public funding of startups can only work if it is global.
It’s not clear however why Europe in particular, which is the only globally respected jurisdiction that can stand up to the United States, is not providing a home of sorts.
One reason might be because Zhao has not quite asked them. They picked the tiny jurisdiction of Malta instead, when it could have been very different if it was Germany, or one of its principates like Luxembourg and Liechtenstein, or France.
That may well be the way they have to go especially as they already have a partnership with CM-Equity AG. Then the exchange would be outside of US’s global jurisdiction, which clearly also includes tiny Hong Kong, but of course they’ll have to comply with European law.
However, they’ll potentially have the opportunity to shape or influence such laws with both Germany and France keen to provide jurisdictional competition by taking a different approach to this ancient prohibition in startups public financing.
But what Zhao will do remains to be seen with his options limited now that his home country, China, has turned hostile towards cryptos.
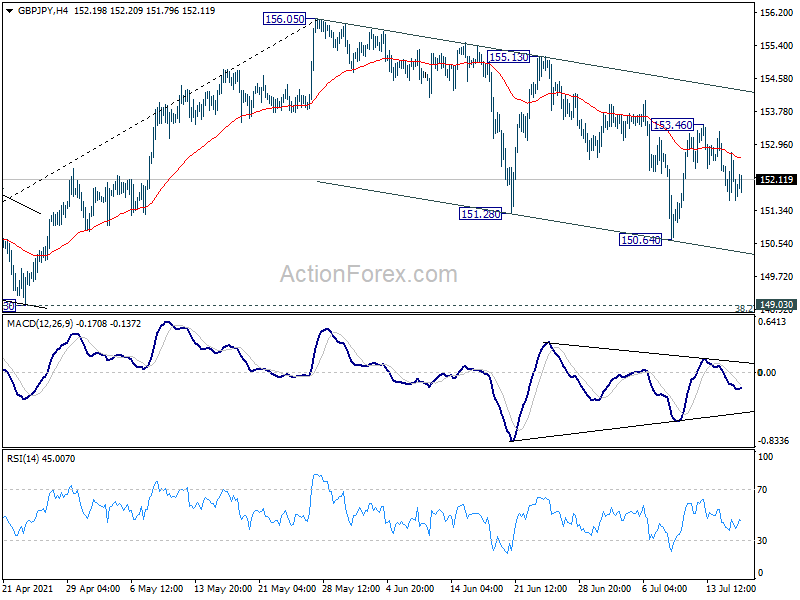
Intraday bias in GBP/JPY remains neutral at this point. Correction from 156.05 could still extend lower. Break of 150.64 will target 149.03 cluster support level. On the upside, break of 153.46 will turn bias back to the upside for 155.13/156.05 resistance zone.
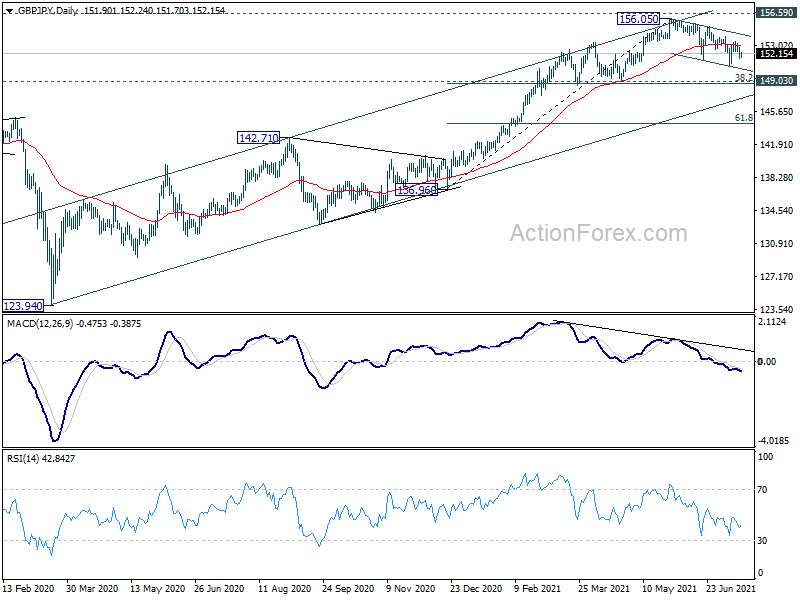
In the bigger picture, rise from 123.94 is seen as the third leg of the pattern from 122.75 (2016 low). Focus remains on 156.59 resistance (2018 high). Sustained break there should confirm long term bullish trend reversal. Next target is 61.8% retracement of 195.86 (2015 high) to 122.75 at 167.93. On the downside, break of 149.03 support is needed to be the first sign of completion of the rise from 123.94. Otherwise, outlook will remain bullish even in case of deep pull back.
A marubozu candle only has a body. It doesn’t have wick or tail.
Bullish marubozu is a long green body candle
Bearish marubozu is a long red body candle
Statistics to prove if the Marubozu pattern really works
Are the odds of the Marubozu pattern in your favor?
How does the Marubozu behave with a 2:1 target R/R ratio?
From our research the Marubozu pattern confirms 88.3% of the time on average overall all the 4120 markets we analysed. Historically, this patterns confirmed within 0.6 candles or got invalidated within 4.2 candles. If confirmed, it reached the 2:1 R/R target 30.5% of the time and it retested it's entry price level 98.6% of the time. Not accounting for fees, it has an expected outcome of -0.085 $/$. It means for every $100 you risk on a trade with the Marubozu pattern you lose $8.5 on average. Want to account for your trading fees? Have the detailled stats for your favorite markets / timeframes? Or get the stats for another R/R than 2:1? 🚀 Join us now and get fine-tuned stats you care about!
How to handle risk with the Marubozu pattern?
We analysed 4120 markets for the last 59 years and we found 538 662 occurrences of the Marubozu pattern. On average markets printed 1 Marubozu pattern every 29 candles.
For 2:1 R/R trades, the longest winning streak observed was 13 and the longest losing streak was 598. A trading strategy relying solely on this pattern is not advised. Anyway, make sure to use proper risk management.
Keep in mind all these informations are for educational purposes only and are NOT financial advice.
What is the Marubozu candlestick pattern?
Marubozu means “bald head” or “shaved head” in Japanese, and this is shown in the absence of wicks or shadow on the candlestick, meaning that the opening or closing price will be the same as the maximum prices of the candle. The absence of shadow indicates that the trading session opened at a high price and close at a low price at the end of the day (or the opposite). The Marubozu candlestick pattern can provide analytical insight into the future direction of the price of a stock.
How to identify the Marubozu candlestick pattern?
It is fairly easy to identify a marubozu pattern because it is a single candlestick having a real body without any kind of shadows. Typically, when bullish, they are white or green on stock charts and when bearish, they are red or black. In bearish marubozu, the open price is equal to the high price and the close price is equal to the low price. For bullish marubozu, the open price is equal to the low price and the close price is the same as the high price.
The identification mark for an ideal spinning top will be:
A large real body
There will be no shadow at either sides of the candle
The color of the candle will be of a significant meaning
In actual market conditions, a perfect marubozu is rare. Therefore, there is a minor difference sometimes – usually less than 0.01 percent of the candle range, between the open/close prices with high/low price is neglected when identifying a marubozu.
Bullish & Bearish Marubozu pattern
What does the Marubozu pattern tell traders?
Marubozu candlesticks can be found on all stock charts and all time frames. Depending on who controlled the day, they can either be bullish or bearish. They are used with technical analysis to show how a stock traded for the day. Usually, stock trading is a competition between buyers and sellers. There are days when one side wins by far, therefore the formation of the marubozu candlestick pattern.
It is a single candlestick pattern that can give insight into the sentiments of the market at a given time. Basically, its appearance means that the market traded to the close without any lasting retracement.
How to trade when you see the Marubozu pattern?
The color of the candlestick shows that either the sellers or buyers have full control of the market. The style of trading will vary depending on the type of marubozu. Before entering a trade, it is advisable for you to wait for another confirmation pattern or candle.
Trading with Bullish Marubozu
The absence of a lower and upper shadow in a bullish marubozu indicates that the low price is the same as the open price and the high price is equal to the close price. Therefore, when you see a candle with open=low and close=high, that is called a bullish marubozu.
This kind of candlestick shows that there is so much buying interest in the stock or the market participants are willing to buy the stock at any price during that trading session. Hence, the price of the stock closed near the high point for that session. If the bullish marubozu is shown at an uptrend, this strongly implies a trend continuation. But when it appears in a downtrend, it shows a trend reversal, that the sentiment of the market has changed and the stock is now bullish.
It is expected that when this sharp change happens, there will be a surge of bullish patterns that are likely to persist over the next trading sessions. Therefore, a trader should look for buying opportunities after the occurrence of a bullish marubozu. It is suggested that the buy price is slightly above the closing price of the bullish marubozu.
Trading with Bearish Marubozu
A bearish marubozu shows that the high price is equal to the open price and the low price is equal to the close price. Therefore, when you see a candle with open=high and close=low, that can be called a bearish marubozu.
This shows that the sellers are in total control of the market. There is so much selling pressure on the stock that the participants of the market are willing to sell the stock at any point during the trading session. Hence, the price of the stock closed near the low point for the session. If the bearish candlestick appears in a downtrend, it means a strong trend continuation. But if it appears in an uptrend, it works as a trend reversal pattern, that is, the sentiment of the market has changed and the stock is now bearish.
It is expected that with this sharp sentiment change there will be a surge of bearishness and it will continue over the next few trading sessions. Therefore, a trader should look for opportunities to sell after the occurrence of a bearish marubozu. The suggested selling price is slightly below the closing price of the marubozu.
How to avoid false Marubozu signals and setting stop-loss
In most instances, the stop-loss for any trade taken on the basis of a marubozu candlestick should be low or high of the candle. Although marubozu is a strong candlestick pattern, it is wise to avoid extremely small (less than 0.5 percent range) or long candle (over 5 percent range).
A candle that is extremely small means a reduced trading activity and therefore it may be a false signal. At the same time, a long candle indicates extreme activity and in that case, the stop-loss for the trade will be deep. Because of this, avoid trading on candles that are either too long or too short. Also, take additional confirmation from another pattern or technical analysis before going into a trade.
Basically, when trading marubozu candlesticks,
Watch for bullish or bearish candlesticks to form
If bullish, take a long when price breaks above
Place stop below candlesticks
If bearish, take a short when price falls below
Place a stop above candlestick
Summary
Marubozu candlesticks can be seen in all chart time frames. One signal alone is not enough to justify a trade. It is necessary to see what the technical analysis is indicating as well as the patterns they are part of. It might seem easy for you to trade during the day using marubozu candlestick patterns, since one side is in control of the day. Take time to study the candlesticks to sharpen your trading skills.
How does the Marubozu pattern look in real life?
stock PHM printed a bullish Marubozu on 2004-12-15. Unfortunately it invalidated on 2005-01-04 before the trade could trigger (it triggered the stop before entering).
stock PHM printed a bullish Marubozu on 2019-08-06 17:30:00. Unfortunately it invalidated on 2019-08-07 13:30:00 before the trade could trigger (it triggered the stop before entering).
stock PVH printed a bullish Marubozu on 2019-03-05 18:30:00. Unfortunately it invalidated on 2019-03-06 14:30:00 before the trade could trigger (it triggered the stop before entering).