Powered By Blogger
Showing posts with label Cryptocurrency Prediction. Show all posts

Monday, 24 January 2022

CRYPTOCURRENCY PREDICTIONS: TOP CRYPTOCURRENCIES RECOVERING FROM CRASH IN 2022

It is easy enough to determine some prominent cryptocurrencies surviving, if and when 8a crash does occur

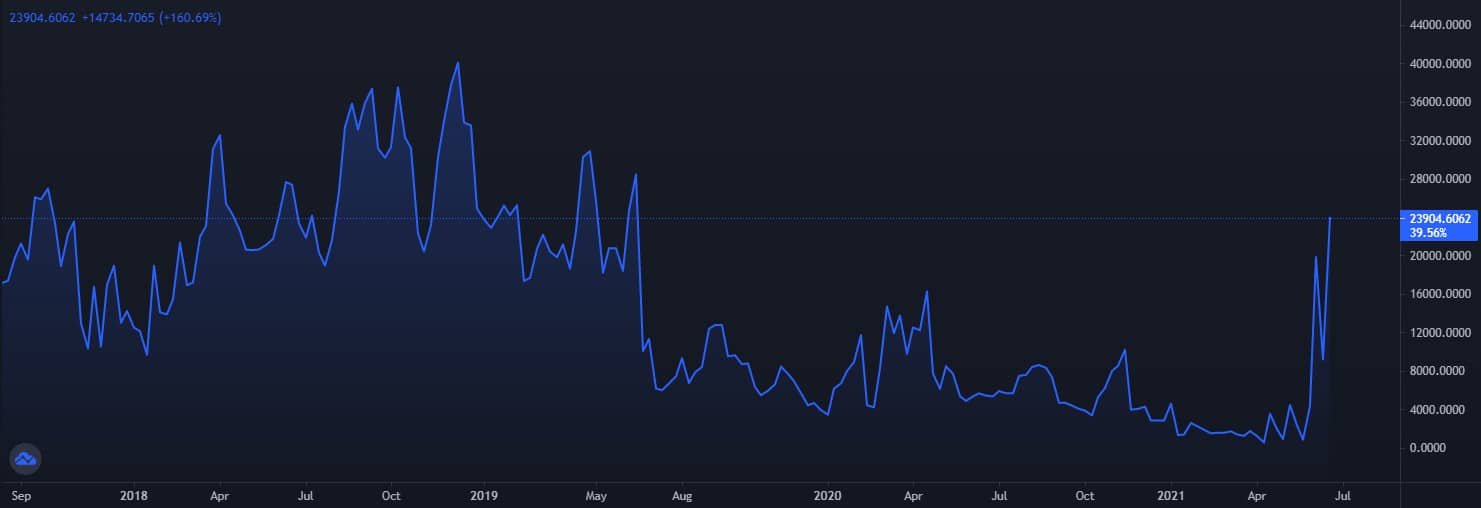
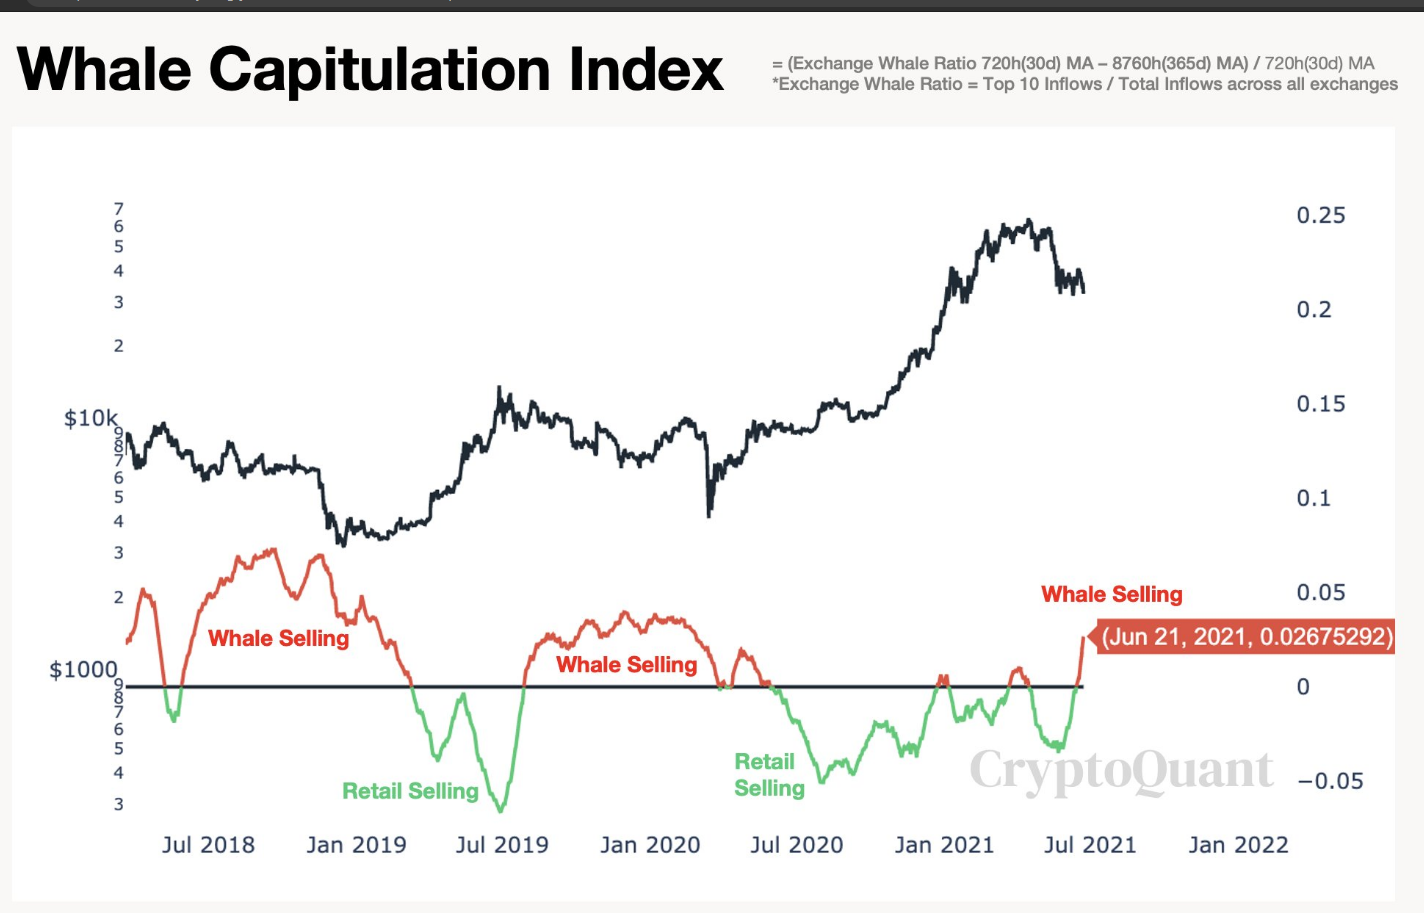
Price volatility is a huge concern in the cryptocurrency market. There’s some degree of volatility involved with the stock market too, but the cryptocurrency market, being fairly new, comes with lesser understanding. Out of all the understanding that experts have, a recent trend was noticed by analysts – cryptocurrency crashes that usually occur on weekends. Stephen McKeon, a finance professor and partner at Collab+Currency, a crypto focussed investment fund explained in an interview that liquidy requires study of the supply of buyers and sellers. If there are few buyers compared to sellers or vice versa, transactions that fluctuate will result in a spike or crash. A good place to start is the top 20 most-traded cryptocurrencies. It is easy enough to determine some prominent survivors in this listing, if and when a crash does occur in cryptocurrency markets.

 Bitcoin

Bitcoin price has slumped to US$43,030 from the high of over US$47,700 on the 1st of January 2021. The falling cryptocurrency prices have dampened the celebration mood of retail crypto investors. But the downward price movement in crypto markets is nothing new, hence not surprising for hardcore crypto enthusiasts. Bitcoin is the original cryptocurrency and is fast emerging as a store of value. Its blockchain and codebase also spawned offshoots, such as Litecoin and Bitcoin Cash. Both are angling to become the preferred cryptocurrency for daily transactions.

Ethereum

Ethereum, the second-largest cryptocurrency by market capitalization saw a substantial drop as well. The Ethereum-based cryptocurrency witnessed a plunge of 8.3% over the past 24 hours after a healthy start to the year. However, Ethereum’s world of decentralized applications or Dapps is fast gaining traction and is responsible for a slew of tokens such as Populous, which are built off its platform.

XRP

XRP is an open-source cryptocurrency that uses an open-source distributed ledger called the XRP ledger. It is the native coin of Ripple, which is an enterprise blockchain company that facilitates global transactions. The creators claim that XRP was built for payments and can settle transactions faster than most other cryptocurrencies securely and efficiently.

Cardano

Cardano is a research-based cryptocurrency built by engineers, mathematicians, and cryptography experts. It is open-sourced and decentralized, with consensus achieved using proof-of-stake. It can also facilitate peer-to-peer transactions with the ADA token. Cardano is one of the cryptocurrencies that are recovering from a crash in 2022.

Polygon

This platform looks to address many of the issues facing the Ethereum blockchain while still providing Defi solutions. Namely, the platform looks to create “Ethereum’s internet of blockchains” by connecting Ethereum-compatible blockchain networks and aggregating scalable solutions on Ethereum. It is also one of the cryptocurrencies that are recovering from a crash.

 Litecoin

As one of the first digital currencies, Litecoin is increasingly getting adopted for real-world use, making it one of the fastest-growing digital currencies. The team has continuously been improving the network to increase speed, reduce cost and increase safety, making Litecoin one of the most attractive payment platforms. The latest update is about the increasing acceptance of Litecoin in the real world. More organizations are adopting LTC, with the recent being NetCent, Bitpay, and Verifone. Now Litecoin holders can buy goods and services from these stores. Litecoin Gaming is another recent development the team updated the community about. More is coming from the team.

Chainlink

Chainlink was designed with the motive of making smart contracts more useful. It is a decentralized network of oracles, which are capable of bringing real-world data into any blockchain network. Chainlink is the largest and most popular oracle network. Owing to its capability of integrating real-world data, the demand for Chainlink oracles will grow in the future.
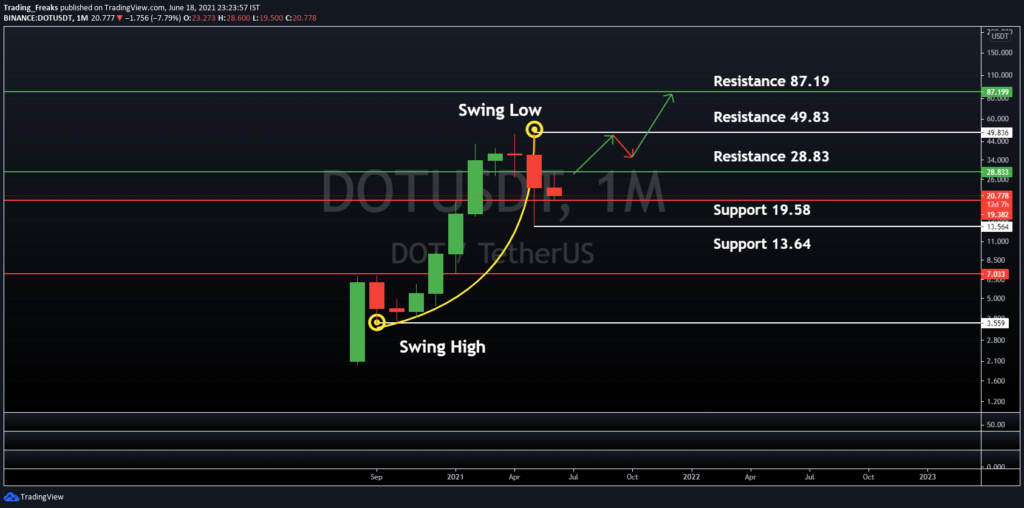
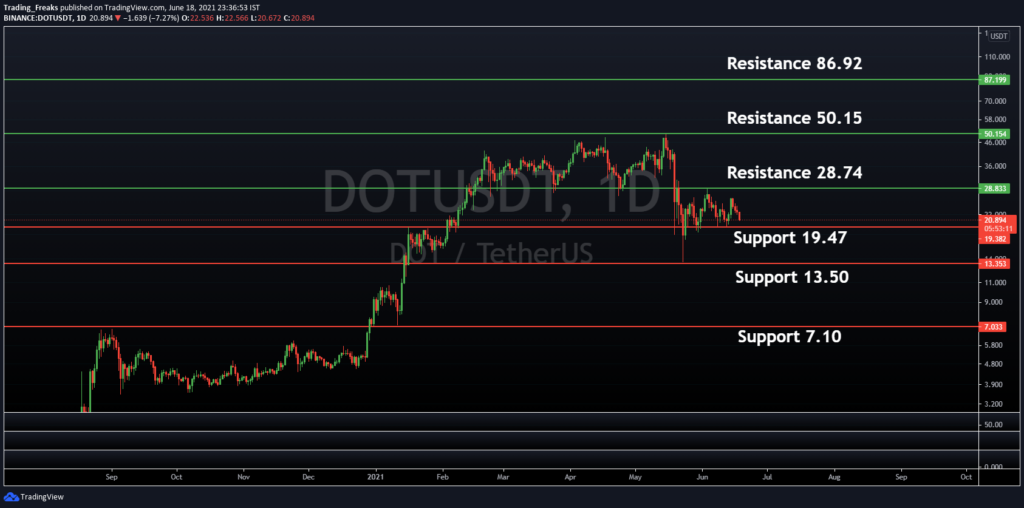
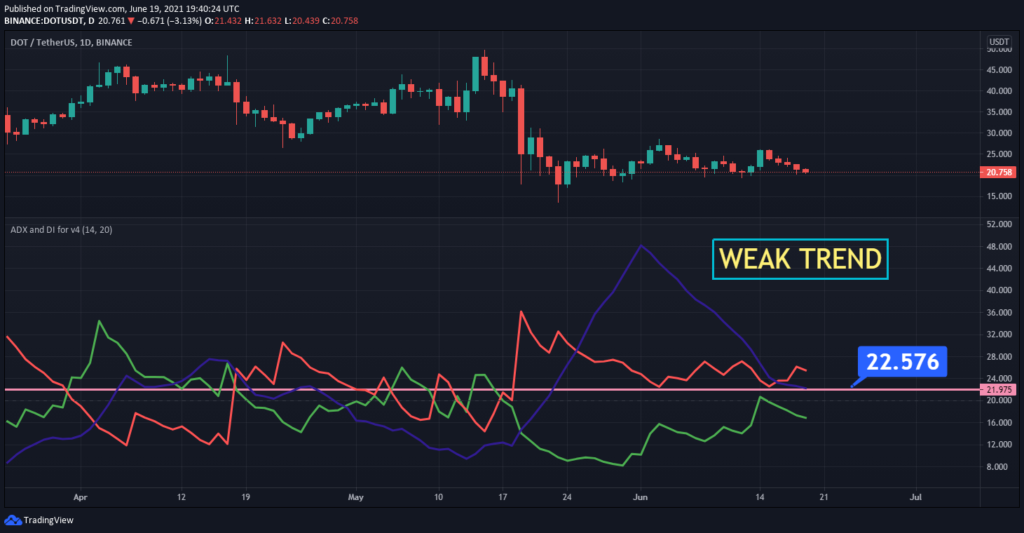
 Polkadot

Polkadot was created based on research identifying the hurdles that blockchain networks will face in the future as crypto is becoming more mainstream and is promoting several innovations in the industry. One of the defining features that DOT possesses is functioning on a network that can connect other blockchain networks.

Dogecoin

The fact that Dogecoin still stands strong after not being taken seriously is a statement in itself. First, Redditors spiked the price to new heights in early 2021 as a way to prevent the speculated short-selling of Dogecoins by many Wall Street hedge funds. And then, Elon Musk called himself the “Dogefather” promoting this cryptocurrency further. While many argue the legitimacy of this coin, Dogecoin continues to have its share of market value.

 Shiba Inu

Launched in August 2020, the rise of Shiba Inu in such a short time is nothing short of uncanny. At one point, Dogecoin stayed as the top meme currency without much competition. However, SHIB, another namecoin that was created out of online jokes that went viral in 2013 came to the play.

Sunday, 4 July 2021

Ethereum Price Prediction: ETH/USD Market Appreciates Gradually

Market Appreciates Gradually – July 4

The trading activity featuring Ethereum and the US fiat currency now appreciates gradually after the recent panic sell-trading situations. The crypto’s valuation, as of writing, stands at about $2,320 at a positive percentage rate of around 4.14.

Market Appreciates Gradually: ETH Market
Key Levels:
Resistance levels: $2,500, $3,000, $3,500
Support levels: $2,000, $1,800, $1,600

/USD – Daily Chart
On the ETH/USD daily trading chart, it shows currently that a bullish candlestick is forming tightly against the sell signal side of the bigger SMA to signify that the crypto market appreciates gradually. The 50-day SMA is positioning to point to the east closely above the 14-day SMA trend-line as the bearish trend-line drew downward to touch the bigger SMA in a supportive manner. The Stochastic Oscillators are in the overbought region, with the lines trying to cross northbound indicate that buying pressure is relatively ongoing.

Will the valuation of the ETH/USD increase further as the crypto market currently appreciates gradually?

It is being showcased on the chart that the ETH/USD currently appreciates gradually; the kind of momentum that bulls have gathered seems not strong enough to launch another buy entry at this time. Only those entries that might have placed below the level of $2,000 may allow running further, probably until the next immediate resistance level of $2,500 before considering profit takings.

On the downside, rejection is expected to come up around the level of $2,500. In the aftermath days’ trading sessions, a downward force should take form by featuring a bearish candlestick around that trading position to signify a re-emergence of downward movement of the market again. Traders needed to be cautious of repositioning their stances while playing alongside the presumed market’s scenario.

ETH/BTC Price Analysis

There has now been that Ethereum’s price currently appreciates gradually against Bitcoin in the comparison. The ETH/BTC price analysis chart shows some variant smaller candlesticks being formed closely on the north side of the smaller SMA. The 50-day SMA indicator and the bullish trend line tightly conjoined below the 14-day SMA trend line. And, they all point toward the north to indicate that the base crypto is on an appreciating motion pairing with the flagship counter crypto. The Stochastic Oscillators are in the overbought region in an attempt to cross the lines northbound further. Yet, that signifies that ETH may still have a better chance of trending furthermore pairing with Bitcoin in the near session.


Looking to buy or trade Ethereum (ETH) now? Invest at SuperForex!


Monday, 28 June 2021

Bitcoin (BTC/USD) Gaps Northbound Slightly

Last Updated: 28 June 2021
Bitcoin Price Prediction – June 28
The trading activity between Bitcoin and the USD fiat currency now slightly gaps northbound to trade around the value of $34,458 at a positive percentage rate of about 5.25.

BTC/USD Market
Key Levels:
Resistance levels: $37,500, $42,500, $47,500
Support levels: $30,000, $27,500, $25,000

BTC/USD – Daily Chart
The BTC/USD daily chart currently depicts that the crypto’s worth gaps northbound away from a lower point above the support level of $30,000. The market presently averages $35,000, where both the smaller SMA trend-line and the bearish trend-line are southwardly underneath the 50-day SMA indicator. The Stochastic Oscillators have crossed the lines to the north slightly against range 40 to signify that a buy pressure is somewhat ongoing.

Could there be a reliable upward move as the market now slightly gaps northbound?

What has technically established regarding the BTC/USD trading operation is that the point of $30,000 may have continually been the most reliable zone for buy entries. Now that the market slightly gaps northbound from around the value, bulls could count upon making an instant execution order to build upon the sudden slight gapping motion.

Countering the beefing upon the current northbound gap moves bears needed to reposition their stance in the crypto market around the levels of $35,000 and $37,500. A further aggressive breakout of those values will potentially put the trade on the path of recovery once again. But, in the long run, the market trading zone of around the level of $40,000 may difficult for a smooth further breakout to the north.

BTC/USD 4-hour Chart

There is a slight northbound push against the upper bearish channel trend-line on the BTC/USD 4-hour chart. The medium-term trend still looks bearish as the market capacity to move further to the north seems to get a reduction as suggested by the Stochastic Oscillators that have moved into the overbought region. The 50-day SMA indicator is above the 14-day SMA trend-line as the upper bearish channel trend-line drew between them to the south. The Stochastic Oscillators have closed the lines in the overbought region. Only a consolidation moving of them could signify further upswings of the crypto market.


Looking to buy or trade Bitcoin (BTC) now? Invest at StormGain !


Litecoin Price Prediction: LTC/USD Price Dumps in $150 and $100

Last Updated:

Litecoin Price Dumps in $150 and $100 – June 27
The market trading situation of LTC/USD still shows that the crypto’s price dumps in between the levels of $150 and $100 to trade around the value of $126 as of writing. The market’s percentage rate is at about 0.05 percent.

Price Dumps in $150 and $100: LTC Market
Key Levels:
Resistance levels: $150, $200, $250
Support levels: $100, $900, $80
LTC/USD – Daily Chart
The LTC/USD daily chart reveals that the crypto’s worth is still somewhat depressed by the US fiat currency as price dumps to trade within the values of $150 and $100. The downward trend is slightly increasing as the SMAs are bending southward further against the resistance lines to attest to the firmness of the declining force in the market. The 50-day SMA is located over the 14-day SMA trend-line as the bearish trend-line remains drawn across them to get placed underneath them. The Stochastic Oscillators have sprung northbound from the oversold region. They now seemingly attempt trying to close the lines near range 40 to possibly portend a re-surface of a declining force in the crypto trade.

Would there be a further breakdown in the LTC/USD market as price dumps in $150 and $100 levels?

The present decline force in the market operation that pairs Litecoin with the US Dollar doesn’t seem to support price dumps further to break down below the smaller level at $100 in the near session. On June 21, the market fell from $150 to trade in a range-bound style a bit above the point of $100 A trading indicator has portended that a declining force may still feature in the market to get a push down to revisit a lower point.

The main barrier trading line has been observed at the level of $150. And, that point would be the trading zone where bears may be posting a decent retardation position while price tends to stop dumping further southward at a later time. A slight forceful decline force against the point of $100 may most likely see a line of price convergences a bit below it which could in no time give way back to an upswing.

LTC/BTC Price Analysis

There has been a continual loss of trending capacity by Litecoin as it pairs with Bitcoin in comparison. Until the present trending outlook, the base crypto’s price dumps more slightly. The SMAs are over the trending spot of the pairing cryptos. The 50-day SMA indicator is over the 14-day SMA trend-line. The Stochastic Oscillators have swerved northbound closely below range 80 in an attempt to close the lines That could lead to seeing the base tool being overwhelmed again by the counter-trading instrument.


Looking to buy or trade Litecoin (LTC) now? Invest at StormGain!


Bitcoin Price Prediction: BTC/USD Price Hunts for $34,000

Last Updated

Bitcoin Price Prediction – June 27

Bitcoin price is fighting to hold above the $32,000 but overhead pressure continues to make this task a difficult one for the bulls.

BTC/USD Long-term Trend: Bearish (Daily Chart)

Key levels:

Resistance Levels: $38,000, $40,000, $42,000

Support Levels: $28,000, $26,000, $24,000

BTCUSD – Daily Chart

At the time of writing, BTC/USD is seeking support above $32,000 to avoid extending the bearish leg to $30,000. The 9-day moving average is also a key level in the mission to avert the losses, perhaps reverse the trend for gains heading to $35,000. Alternatively, the BTC bulls need to find acceptance above the intraday high of $33,590 to refuel the recovery momentum.

Bitcoin Price Prediction: Can Bitcoin Price Go Higher?

The Bitcoin price is stable above $32,500 as it is currently attempting an upside break above the 9-day and 21-day moving averages. Meanwhile, a close above $34,000 could open the doors for a larger increase in the coming sessions as BTC/USD is slowly moving higher towards the $34,000 resistance level. However, the key resistance level may be located around $36,000, while the bulls could hit the potential resistance at $38,000, $40,000, and $42,000 in the near term.

On the other hand, if there is no clear break above $33,000, there are chances of a fresh decline. However, as the 9-day MA remains below the 21-day MA, the coin may stay within the negative side and initial support is near the $30,000 level. The main support is now forming near the $31,000 level, below which the price could dive towards the supports of $28,000, $26,000, and $24,000 as the technical indicator Relative Strength Index (14) remains above the 40-level.

BTC/USD Medium – Term Trend: Ranging (4H Chart)

On the 4-hour chart, a retest of $32,900 gives the impression that the bulls are not yet done with the market movement. The Bitcoin price rises to fill a significant gap as the bulls may take the coin towards the $33,000. In a short time, the Bitcoin price may hit $34,000 if the bullish pressure continues. Otherwise, the price may revisit the supports of $31,000 and below.

BTCUSD – 4 Hour Chart

On the upside, a bullish move may h OKit the resistance at $35,000 and above. As of now, the Relative Strength Index (14) is moving below 50-level, this could mean that the Bitcoin price may still trade downward.

Looking to buy or trade Bitcoin (BTC) now? Invest at StormGain !

Litecoin Price Prediction: LTC/USD Failed to Climb $130


Litecoin Price Prediction – June 27

The daily chart shows that the Litecoin price could not climb above the $130 level as the price touches the low of $124.

LTC/USD Market

Key Levels:

Resistance levels: $175, $185, $195

Support levels: $80, $70, $60

LTC/USD is currently struggling to gain momentum past the $130 mark. Meanwhile, a major support level remains at $124, but if it breaks with a daily candle closing below the level, it is likely that the Litecoin price falls below the lower boundary of the channel.

Litecoin Price Prediction: What to Expect from Litecoin

As reveals by the daily chart, the Litecoin price is hovering below the 9-day and 21-day moving averages. However, if the market price crosses above the 9-day and 21-day moving averages, it can enjoy a period of bullish momentum and it could target the $150 resistance level before potentially looking towards the resistance levels of $175, $185, and $195.

Therefore, if Litecoin (LTC) suffers a breakdown in price below $120, Litecoin may likely suffer a worse fate as it would confirm a downtrend with lower highs and lower lows. Should in case the price decides to stay below the channel, the coin may likely find the critical supports at $80, $70, and $60 as the technical indicator Relative Strength Index (14) suggests a sideways movement.

Against Bitcoin, the Litecoin price is currently following a bearish sentiment as the coin remains under the 9-day and 21-day moving averages. However, if the bulls attempt to gain momentum, the bears are likely to keep releasing a huge pressure on the market as the technical indicator Relative Strength Index (14) stays below 40-level, suggesting more bearish signals.

However, if the Litecoin price falls below the lower boundary of the channel, it may likely hit the nearest support at 3400 SAT. Any further negative movement could significantly lower the price to 3300 SAT and below. In case of a rebound, the coin may test the 4400 SAT above the 9-day and 21-day moving averages before resuming the rally. If the bulls manage to stay well above this barrier, traders could see a bull-run to the resistance level of 4600 SAT and above.

Looking to buy or trade Litecoin (LTC) now? Invest at StormGain !


Bitcoin Cash Price Prediction – BCH/USD Touches $470 High

Bitcoin Cash Price Prediction – July 12

The Bitcoin Cash sees bulls to $470 resistance level after the coin touches the daily low of $446 support.

BCH/USD Market

Key Levels:

Resistance levels: $750, $800, $850

Support levels: $200, $150, $100


At the time of writing, BCH/USD is pushing for consolidation around $462 but the trend has a bearish inclination, which may likely retest the support at $400 as it may keep the price below the 9-day and 21-day moving averages. However, the technical indicator is seen giving a sideways movement as the Relative Strength Index (14) moves in the same direction which reflects the influence the sellers have over the price.

Bitcoin Cash Price Prediction: Any Drawdown Likely?

The Bitcoin Cash price is seen hovering under the 9-day and 21-day moving averages. Meanwhile, the best the bulls can do is defending the support at $400 and focus on pulling towards $350. A few days ago, the Bitcoin Cash lost balance alongside other cryptos and the sharp drop affected the buyers from an attempted recovery above $450. However, BCH/USD is making an effort to jump above $500 and it is also looking forward to reclaiming the ground past $600.

The Bitcoin Cash price is already on the negative side and therefore a reflex bullish action is expected to correct the declines with a possible jump above $700. Meanwhile, if there is an increase in buying pressure, the price may break above the 9-day and 21-day moving averages to reach the $700 resistance. While trading at that level, a bullish continuation could push the coin to the resistance levels of $750, $800, and $850 respectively.

On the contrary, a minimum swing may likely bring the market to a $300 level of support. Exceeding this level could take the bears to the supports of $200, $150, and $100 by crossing below the lower boundary of the channel.

Against Bitcoin, the daily chart reveals that traders have yet to show a strong commitment to buying on the market. Meanwhile, as soon the bulls turn strong, traders may expect the market to skyrocket above the channel to hit the resistance level of 1800 SAT and above.


However, the 1200 SAT may likely produce support for the market should in case the buyers fail to push the price above the channel. Therefore, BCH/BTC pair may continue to show the downward trend as the technical indicator Relative Strength Index (14) signal line moves to cross below into the oversold region.

Looking to buy or trade Bitcoin Cash (BCH) now? Invest at LUNO!

75% of retail investor accounts lose money when trading CFDs with this provider

Remember, all trading carries risk. Past performance is no guarantee of future results.

Saturday, 26 June 2021

Bitcoin Shorts Hit 2-Year High on BitFinex: $30K Breakdown or Short Squeeze Incoming?

The number of open shorts positions on leading cryptocurrency and derivatives exchange BitFinex is at a two-year high as bitcoin price returns to the monthly lows amid $30K.

The current amount of shorts is the highest since June 17, 2019, forcing more traders to wonder whether BTC is set for further dips, which may lead to a first daily close below $30K since January 1st, 2021.

Bitfinex Shorts Hit 2-Year High

According to recent data by TradingView, short positions on Bitfinex saw a sharp increase in the early hours of Friday, just before Bitcoin’s price dropped by $4,000 towards yesterday’s low of $31.2K, according to Bitstamp. Today, the number of open shorts increased even more, setting a new 2-year high.

The same event, of a rapid sharp increase, was witnessed a few days ago, as short positions piled up to reach their peak on June 18, and then decreased significantly until reaching a 2-week low as of yesterday, June 25, before sharply rising once again.


Zooming in the chart can reveal a quick increase followed by a drop on Tuesday, June 22, which marked the lowest price Bitcoin traded for since January – $28,600.s mentioned above, the increase in the number of shorts yesterday and today has pushed shorts positions on Bitfinex to levels not seen in the last two years. There is now 23900 BTC worth of open short positions, valued at almost $700 million as of writing these lines.

The number even reached almost 26500 BTC short positions earlier today, which marked the highest since June 17, 2019.

shorts-jun26
Bitfinex open short positions, 5 years. Chart by TradingView

Bitcoin Whale Behind And Some Bullish Hope

The current spike in shorts on Bitfinex was reportedly due to a whale shorting a significant amount of bitcoins on the platform. Wu Blockchain noted that the whale borrowed 15,157 BTC, and the action broke the long-short ratio, causing the number of short positions to increase significantly.

Meanwhile, the bulls are not relenting as the total number of long positions continues to hold strong and currently at its ATH, perhaps due to the strong fundamentals surrounding bitcoin.

Recently, El Salvador became the first country to adopt bitcoin as a legal tender under a new Bitcoin Law, which will see employees getting paid in bitcoin and several other transactions conducted in the country with the cryptocurrency.

To further boost its chances of implementing the bitcoin law within the country, El Salvador’s president, Nayib Bukele, revealed that the government would give every adult El Salvadoran citizen $30 worth of bitcoin.

The bulls might not lose hope since a high amount of short positions can sometimes lead to a massive short squeeze – where short positions are forced to liquidate due to positions reaching their stop loss and drive more buying power into the market. However,

SPECIAL OFFER (Sponsored)
Binance Futures 50 USDT FREE Voucher: Use this link to register & get 10% off fees and 50 USDT when trading 500 USDT (limited offer).

PrimeXBT Special Offer: Use this link to register & enter POTATO50 code to get 50% free bonus on any deposit up to 1 BTC.

Tuesday, 22 June 2021

Bear Market Confirmed, Says CryptoQuant CEO


Ki Young Ju, the CEO of leading on-chain analytics firm CryptoQuant, claims that a new Bitcoin bear market has been confirmed in a recent tweet:

I hate to say this, but it seems like the $BTC bear market confirmed.

He notes that large holders have started sending coins to exchanges en masse, which is a sign of “whale capitulation.”    

Bear market

Earlier today, Bitcoin dipped all the way to $31,700 on the Bitstamp exchange. At press time, the cryptocurrency continues to trade nearly the daily low.

The market is facing severe selling pressure amid China’s worsening crackdown on crypto.

MicroStrategy’s $489 million Bitcoin purchase—which was revealed earlier today—failed to tame the ferocious bears

What is Telcoin and Why Did it Increase 43,000% in 2021?

Today's video is dedicated to Telcoin - a crypto that hasn't managed to break into the top of the crypto charts but it did get a lot of attention on social media and seems to have a large and growing following.

Telcoin is an Ethereum-based crypto established in July 2017 in Singapore to become the connecting point between crypto, blockchain, and the telecom industry.

The project aims to partner with leading names in the telecom industry in the US and globally and scale through their reach. Names like Verizon (NYSE:VZ) and AT&T (NYSE:T) have been mentioned as platforms through which the hassle that exists between billing platforms and mobile money can be removed.

The primary focus are remittance markets. While there are almost five mobile phones to a bank account in existence, people still queue up to send money from high-cost remittance agents, with Western Union (NYSE:WU) being the largest.

Leveraging the power of blockchain, Telcoin is bringing people in the developing world a faster, low-cost alternative to remittance services.

Telecom operators that connect to the Telcoin network are immediately able to issue TEL tokens. The network gives incentives; the more the TEL token traffic an operator has, the more incentives he gets from the network.

Monday, 21 June 2021

Polis (POLIS) Price Hits $0.10 on Major Exchanges


(CURRENCY:POLIS) traded up 2.7% against the dollar during the one day period ending at 18:00 PM Eastern on June 20th. One Polis coin can currently be purchased for $0.10 or 0.00000289 BTC on major exchanges. In the last week, Polis has traded 33.5% lower against the dollar. Polis has a market capitalization of $1.01 million and approximately $186.00 worth of Polis was traded on exchanges in the last day.

Here is how similar cryptocurrencies have performed in the last day:

 
  • AC Global (PAC) traded up 0.5% against the dollar and now trades at $0.0130 or 0.00000022 BTC
  • The Sandbox (SAND) traded down 3% against the dollar and now trades at $0.24 or 0.00000676 BTC.
  • Crust (CRU) traded 2.8% lower against the dollar and now trades at $42.40 or 0.00117874 BTC.
  • Davinci Coin (DAC) traded down 1.1% against the dollar and now trades at $0.0021 or 0.00000006 BTC.
  • Venus LTC (vLTC) traded 0.6% higher against the dollar and now trades at $3.12 or 0.00008767 BTC.
  • Cyclone Protocol (CYC) traded down 15.8% against the dollar and now trades at $545.40 or 0.01533602 BTC.
  • BinaryX (BNX) traded down 14.5% against the dollar and now trades at $5.20 or 0.00014610 BTC.
  • Pizza (PIZZA) traded 5.7% lower against the dollar and now trades at $0.0570 or 0.00000160 BTC.
  • Krios (GIG) traded 2.7% higher against the dollar and now trades at $0.0030 or 0.00000008 BTC.
  • Startcoin (START) traded 0.1% lower against the dollar and now trades at $0.0094 or 0.00000026 BTC.

Polis Profile

Polis (POLIS) is a proof-of-work (PoW) coin that uses the X11 hashing algorithm. Polis’ total supply is 9,831,891 coins. The Reddit community for Polis is /r/Polispay and the currency’s Github account can be viewed here. Polis’ official message board is forum.polispay.org. Polis’ official Twitter account is @PolisBlockchain and its Facebook page is accessible here. Polis’ official website is polispay.org.

According to CryptoCompare, “Polis is a community driven cryptocurrency for fast transactions and payments. Polis is used on Polispay app the multi coin wallet as main currency with its own ecosystem like gift cards and debit cards.Polis gives you the opportunity to buy these gift cards and vouchers without any additonal fees. The complete project is governed as a DAO. Polis uses advanced decentralized blockchain technology to solve major problems for the global community. wPolis or wrapped Polis is 1:1 backed by Polis coin. This token was generated to make Polis available for the Ethereum network and it is traded on Uniswap.   “

Polis Coin Trading

It is usually not possible to purchase alternative cryptocurrencies such as Polis directly using US dollars. Investors seeking to acquire Polis should first purchase Bitcoin or Ethereum using an exchange that deals in US dollars such as GDAX, Coinbase or Changelly. Investors can then use their newly-acquired Bitcoin or Ethereum to purchase Polis using one of the exchanges listed above.

Receive News & Updates for Polis Daily - Enter your email address below to receive a concise daily summary of the latest news and updates for Polis and related

Litecoin / Dollar intraday: rebound towards 85.80


Our pivot point is at 77.60.

Alternative scenario: the downside breakout of 77.60 would call for 74.60 and 72.80.

Trading Central2020-12-16
71


Our preference: rebound towards 85.80.

Alternative scenario: the downside breakout of 77.60 would call for 74.60 and 72.80.

Comment: the RSI is below its neutrality area at 50. The MACD is negative and above its signal line. The configuration is mixed. Moreover, the price is trading under both its 20 and 50 period moving average (respectively at 80.70 and 81.30).

Supports and resistances:

89.40 **

87.60 *

85.80 **

84.00

80.43 last

78.80

77.60 **

Disclaimer
The trading strategy containing reference trading prices and analysis opinions is provided by the third-party provider Trading Central.And the trading strategy is only the personal research and judgment by analysts,which is not a statement of facts.No representation or warranty is given as to the accuracy or completeness of this strategy. Consequently any person acting on it does so entirely at their own risk. TOP1 accepts no responsibility for any use that may be made of these comments and for any consequences that result.

Sunday, 20 June 2021

Polkadot Price Prediction 2021 – Will DOT Hit $100 Soon?


  • Bullish DOT price prediction ranges from $28.74 to 86.92
  • DOT price might also reach $100 soon.
  • DOT bearish market price prediction for 2021 is $19.47

In Polkadot (DOT) price prediction 2021, we use statistics, price patterns, RSI, and much other information about DOT to analyze the future movement of the cryptocurrency. 

Polkadot is an open-source sharding multichain protocol that provides the cross-chain transfer of any information or asset types, not just tokens, however making a wide range of blockchains interoperable with each other.

According to CoinGecko, the DOT price is trading at $21.11 with a 24-hour trading volume of $1,507,292,030, at the time of writing. However, DOT has decreased by 3.29% in the last 24 hours.

Moreover, DOT has a circulating supply of 953,313,729.46 DOT. Currently, DOT trades in cryptocurrency exchanges such as Binance, OKEx, Huobi Global, CoinTiger, and FTX. 

Polkadot (DOT) Price Prediction 2021

Polkadot (DOT) holds the 9th position on CoinGecko right now. DOT price prediction 2021 explained below with a monthly time frame.

DOT/USDT Price Chart Monthly Time Frame (Source: TradingView)

The above chart shows the swing low and swings high of Polkadot. A swing low is identified when the price makes a low and is immediately followed by two consecutive higher lows. Likewise, a swing high is represented when the price makes a high and is proceeded by two consecutive lower highs.

In the monthly time frame chart,  if the price of the DOT breaks the resistance level of $28.83, it will reach the target of $49.83 and $87.19. Or else, if the price of the DOT breaks the support level of $19.58 means it will fall to the next support level at $13.64. So, the trend of the DOT is based on the breakout.

DOT Support and Resistance Level

The below chart shows the support and resistance level of DOT.

DOT/USDT Support and Resistance Level (Source: TradingView)

From the above daily time frames, it is clear the following are the resistance and support level of DOT.

  • Resistance Level 1 – $28.74
  • Resistance Level 2 – $50.15
  • Resistance Level 3 – $86.92
  • Support Level 1 – $19.47
  • Support Level 2 – $13.5
  • Support Level 3 – $7.1

The charts show that DOT has performed a bullish trend over the past month. If this trend continues, DOT might run along with the bulls overtaking its resistance level at $86.92.

Conversely, if the investors turn against the crypto, the price of DOT might plummet to almost $19.47, a bearish signal.

Polkadot (DOT) Average Directional Index (ADX)

Now let’s look at the average directional index (ADX) of DOT. Generally, the Average Direction Index (ADX) helps traders determine the strength of a trend, rather than its actual direction. It can be used to determine whether the market is changing or a new trend is starting. It is associated with the Directional Movement Index (DMI) and basically includes the ADX line. 

The range of the oscillator is from 0 to 100. A high value indicates a strong trend, and a low value indicates a weak trend. It is often combined with directional indicators. 

DOT/USDT ADX(Source: TradingView)

The above chart shows the ADX of DOT stays above the range of 22, so it indicates a sideways trend.

Conclusion

The DOT is one of the cryptos that keeps its ground against the bearish market. Furthermore, our long-term DOT price prediction 2021 is bullish. It has a huge possibility of overtaking its current all-time-high (ATH) of $49.69 this year. However, this will only happen if it breaks many past psychological resistances.

Furthermore, with the ongoing developments and upgrades within the DOT ecosystem, it could experience a great future ahead in 2021. It may reach $86.92 soon and it might even reach high heights, however reaching $100, if investors have planned that DOT is a good investment in 2021.

Disclaimer: The opinion expressed in this chart solely author’s. It does not interpreted as investment advice. We encourages all to do their own research before investing.

Wednesday, 16 June 2021

news/bullish-all-the-way-microstrategy-doubles-down-on-its-bitcoin-bet


MicroStrategy’s latest bond offering seeks to deliver a yield of 6.25%–6.5% — significantly higher than an average junk bond yield of 4.01%.

There’s never a dull day when it comes to crypto as was exemplified recently when the digital asset market dipped by around 50%, eventually taking the total capitalization from its all-time high of $2.5 trillion to around $1.7 trillion. 

As was expected, in the wake of all this turbulence, Michael Saylor-led business intelligence firm MicroStrategy announced that it was all set to “buy the dip” — successfully concluding its $500-million offering of secured notes.

To further elaborate on the matter, per a statement released by the company, it was revealed that MicroStrategy had been able to facilitate a sale of $500 million worth of “senior secured notes” via a private offering to a set number of buyers based out of the United States. Of the above-stated total, after expense deductions, initial purchaser discounts and commissions are taken into consideration, the net total will work out to $488 million, the entirety of which will be used for additional Bitcoin (BTC) acquisition by the firm.

To quickly recap MicroStrategy’s recent crypto purchasing efforts, it should be highlighted that since August of last year — a time when the firm bought $250 million worth of BTC — the company has been on a Bitcoin-buying frenzy, as is highlighted by the fact that the firm holds a total of 92,079 BTC, which works out to nearly $3.8 billion.

Lastly, it bears mentioning that if BTC’s value continues to hover around the $40,000 zone, MicroStrategy will most likely be able to add around 11,900 Bitcoin to its balance sheets, bringing the company’s total crypto haul to over $4.2 billion.

MicroStrategy’s move smart or not?

On June 7, MicroStrategy announced the launch of the aforementioned private offering, initially stating that it was looking to raise around “$400 million aggregate principal amount”; however, as highlighted previously, this number now stands close to $500 million. What’s more, following the announcement, Michael Saylor claimed that his company had already received $1.6 billion worth of orders for their latest offering — i.e., four times the initial amount.

Kadan Stadelmann, chief technology officer of Komodo — a blockchain solutions provider — told Cointelegraph that MicroStrategy’s move isn’t that surprising, especially when considering that its newly formed subsidiary, MacroStrategy LLC., already owns a lot of BTC, adding:

“Michael Saylor is clearly focused on a long-term investment strategy rather than short-term gains or losses. Putting company debt on the line is risky, but it could obviously lead to a massive return as well.”

In this regard, it bears mentioning that the development has clearly had a positive impact on the Bitcoin market. In confluence with other positive news, the price of BTC has jumped from just over $35,000 to over $40,000 since the announcement. “The market does appear bearish overall despite this news, but one or two more stories of major institutional adoption of Bitcoin or other cryptos could very well bring the bull market back,” Stadelmann concluded.

Similarly, Konstantin Anissimov, executive director for cryptocurrency exchange CEX.IO, told Cointelegraph that the consistency with which MicroStrategy has continued to amass Bitcoin has been contagious, to say the least. In his view, the $500-million bond strategy is a means of emphasizing the company’s highly futuristic outlook:

“MicroStrategy appears to be seeing a very promising future for Bitcoin that no one else is seeing. While these moves may not in themselves move the price of Bitcoin, MicroStrategy will be one of the biggest beneficiaries when prices get to trade above previous all-time highs.”

Is Bitcoin severely undervalued?

MicroStrategy’s continued crypto accrual raises a pertinent question: Is Bitcoin undervalued right now? Daniel Peled, co-founder of Ethereum-based interoperable blockchain platform Orbs, told Cointelegraph that he is mightily impressed with Saylor’s conviction regarding Bitcoin as well as his general treasury management decisions, especially during these times of unprecedented quantitative easing, adding:

“The market currently undervalues BTC, based, among other things, on the high deflection from the stock-to-flow model, the NVT signals, and the fact that Elon Musk confirmed that Tesla has not sold any of its remaining BTC and may accept BTC as payment if enough miners will transition to clean energy.”

Peled further opined that MicroStrategy has added to this excellent timing by setting up its bond offering, ensuring that only the BTC purchased with the proceeds from the offering are senior secured and that the annual interest rate is significantly below the company’s annual profit levels, giving it the ability to cover its payments at least for the foreseeable future.

The above-highlighted structure effectively limits the ability of the company’s core business and assets to be negatively affected, particularly if its bet on buying additional BTC doesn’t pay off. “It sets up MicroStrategy to enjoy the benefits when the BTC market corrects to reflect the fundamentals,” Peled believes.

The road ahead for MicroStrategy and Bitcoin

When MicroStrategy kicked off its plan to start buying crypto via its first corporate bond issuance scheme, Bitcoin’s value was hovering at around the $17,000 threshold only to explode by nearly four times over the course of the next few months. Thus, it stands to reason that the firm probably sees big things for BTC in the near to mid-term, especially after this period of ongoing turbulence subsides.

Also, as pointed out earlier, owing to the fact that MicroStrategy’s latest offering was reportedly oversubscribed upon its launch, there still seems to be a large appetite for Bitcoin across the global investor landscape. Not only that, even the United States Security and Exchange Commission’s decision regarding VanEck’s Bitcoin ETF application is currently pending, which, if approved, may serve as another catalyst for continued BTC adoption.

Steven Gregory, CEO of cryptocurrency exchange Currency.com’s U.S. subsidiary, told Cointelegraph, “The one almost ironic event to come out of this bond issuance is the Fed unknowingly having exposure to this round through their junk-buying program.”

Related: GME and AMC stock surge may impact crypto meme coins, BTC not so much?

Jack Tao, CEO of cryptocurrency exchange Phemex, believes that this move is consistent with the overall trend of institutional money flowing into crypto. However, what’s striking to him is the fact that all of these developments are taking place despite the persisting bearish conditions, as he told Cointelegraph: “Many in the world of traditional finance are starting to realize crypto’s potential to ignite an unprecedented paradigm shift. They’re beginning to invest into the technology rather than just chasing speculative profits.”

A risky bet?

MicroStrategy’s decision to borrow from the corporate junk bond market to finance its BTC acquisition seems to clearly reflect heavily on the U.S. Federal Reserve’s current inflationary “quantitative easing” policy that was designed to help soften the blow inflicted by the COVID-19 pandemic on the American economy.

In fact, the numbers say it all, as is best highlighted by the fact that corporate borrowing has never been easier. For example, MicroStrategy’s latest offering promises a 6.25%–6.5% yield compared to the average junk bond yield of 4.01%.

Therefore, it will be interesting to see whether others follow in Saylor’s footsteps and continue to accumulate Bitcoin, especially after it was recently announced that El Salvador was going to start accepting the flagship crypto as legal tender.


Saturday, 12 June 2021

Bitcoin Price Analysis: BTC Awaits a Breakout After Month Long Consolidation


Ever since BTC fell nearly 60% from ATH, it has been thrown back & forth awaiting a breakout. Investors continue to get overwhelmed with bullish & bearish news which has created a large amount of indecision throughout the cryptocurrency space. Bulls want to believe the bull market is still underway and bears are calling for the start of the bear market.

Price Analysis: BTC/USDT 1 Day Chart


Bears & bulls have been fighting for nearly a month which has created a descending channel. This formation is neutral until a trend is broken. Along with the top trend of the channel lies the 25 Day MA. Once BTC can break these two marks , a bullish revival to 40k+ will be in place. On the bearish view, if BTC fails to hold the $33,500 support, it may be in for another -20% fall. As of now, signs are pointing more towards a revival to 40k+.

While viewing the Stochastic RSI, we can see the strength is on its way back to overbought conditions. This is a great sign as long as price can break major resistance of $38,200. To confirm a potential bullish move, the regular RSI has broken over a trend line that has acted as resistance for nearly 115 days. As long as strength can break the 50 mark, a bullish trend is imminent.

BTC Intraday Levels

  • Spot rate: $37,148
  • Trend: Neutral
  • Volatility: High
  • Support: $36,600
  • Resistance: $38,200

Promo Code: BNS49991763


DISCLAIMER: The content of this material represents the view of our analysts on a generic basis and do not take into consideration individual readers personal circumstances, investment experience or current financial situation. The content of this material constitutes Marketing Communication and does not constitute Investment Advice or Investment Research. Financial & Global Investment and/or its brands may provide general commentary, which is not intended as investment advice and must not be construed as such. Financial & Global Investment shall not accept any responsibility for any losses of traders due to the use and the content of this material

Thursday, 10 June 2021

Bitcoin Price Analysis: First Signs That BTC Found a Local Bottom Yesterday

Bitstamp BTC/USD Daily Chart


Bitcoin is up by 12% from yesterday’s low of $31,000, according to Bitstamp, and is currently battling to climb above a descending trend line that spans the first week of June.

The primary cryptocurrency saw a turbulent week after breaking beneath the previous symmetrical triangle pattern on Monday. BTC kept sliding following the bearish breakout as it even broke the late-May support at $33,500 and continued lower yesterday to hit the low at $31,000, which was the lowest price for BTC since May 19 crash

However, the rebound was rapid, as bitcoin found a temp bottom at $31,000 – the same level at which it rebounded on May 23. In conclusion, after another very volatile they, the market eventually closed yesterday’s candle at the same price it opened, at around $34,000.

Today, BTC continued to push higher above $34,000 and managed to get to $35,450 before running into a descending trend line that started from the early-June highs. A bearish .5 Fib further bolsters the resistance at $35,230, measured from the June high to low.

Optimistically, if today’s candle can close beyond $35,000, the market would form a morning star candlestick pattern, which is a bullish reversal pattern formed over the last three days of trading.

BTC Price Support and Resistance Levels to Watch

Key Support Levels: $34,760, $34,000, $33,520, $33,000, $32,465.

Key Resistance Levels: $35,230, $36,220, $36,750, $37,630, $38,570.

Looking ahead, the first resistance lies around $35,230 (bearish .5 Fib & descending trend line). This is followed by $36,220 (bearish .618 Fib), $36,750 (20-day moving average line), $37,630 (bearish .786 Fib), and $38,570 (bearish .886 Fib).

On the other side, the first major support is expected at $34,760. This is followed by $34,000 (late-May horizontal support), $33,520, $33,000, and $32,465. Further down lies yesterday’s low at $31K.

The daily RSI remains in the bear’s favor. However, it is starting to regain momentum, which indicates that the short-term bearish momentum is fading again. Yet, it would need to push beyond the midline and break the early-June spike above 50 to indicate any sustainable bullish momentum.

The RSI has finally spiked above the midline on the short-term chart, indicating short-term bullish momentum is showing up again. It would need to rise beyond 60 for this bullish momentum to be sustained.

Bitstamp BTC/USD 4-Hour Chart

Binance Futures 50 USDT FREE Voucher: Use this link to register & get 10% off fees and 50 USDT when trading 500 USDT (limited offer).

PrimeXBT Special Offer: Use this link to register & enter POTATO50 code to get 50% free bonus on any deposit up to 1 BTC.


Disclaimer: Information found on CryptoPotato is those of writers quoted. It does not represent the opinions of CryptoPotato on whether to buy, sell, or hold any investments. You are advised to conduct your own research before making any investment decisions. Use provided information at your own risk. See Disclaimer for more information.

Wednesday, 9 June 2021

Bitcoin (BTC) Price Prediction: BTC/USD Makes Gradual Decline as Bitcoin Risks $28,000 Low


Bitcoin (BTC) Price Prediction – June 9, 2021

On May 8, Bitcoin declined to $31,000 support as Bitcoin risks $28,000 low. Following its initial fall from the $39,000 high, the king coin is making a gradual decline to the critical support at $30,000. BTC/USD has fallen to the bearish trend zone as price makes a series of lower highs and lower lows. Bitcoin bulls have an uphill task to defend the critical support at $30,000.

Resistance Levels: $45,000, $46,000, $47,000
Support Levels: $35,000, $34,000, $33,000

Yesterday, the bearish run continued as sellers pushed BTC’s price to the low of $31,075 support. Immediately, the bulls bought the dips as price corrected upward. The upward correction has reached a high of $33,837. However, for Bitcoin to overcome the bearish run, buyers have to push the coin above $39,000 resistance. The bullish momentum must be sustained above $40,000 high. A break above the $40,000 resistance will propel the BTC price to rally to $46,000 high. Today, crypto is correcting upward after falling to the critical support level. The current selling pressure will resume if the bears terminate the upward correction. That is if BTC’s price faces rejection at the recent high and plunges below the $30,000 support level. Bitcoin will fall and reach the $28,000 low.

Trump Calls Bitcoin a Scam, Supports Dollar Hegemony as Bitcoin Risks $28,000 Low

Former U.S. President Donald Trump has indicated that the dollar should remain the “currency of the world.” While calling Bitcoin (BTC) a scam. According to President Donald Trump, he said: “Bitcoin, it just seems like a scam […] I don’t like it because it is another currency competing against the dollar. Essentially, it is a currency competing against the dollar. I want the dollar to be the currency of the world, that’s what I’ve always said.” Following the breakdown on the $31,000, BTC price resumed upward correction after the recent fall. The downtrend will resume if the upward correction faces rejection.

Meanwhile, on May 27 downtrend; a retraced candle body tested the 38.2% Fibonacci retracement level. The retracement indicates that the BTC price is likely to fall to level 2.618 Fibonacci extension or level $31,210.00. From the price action, Bitcoin tested the Fibonacci 2.618 level as price corrected upward.

#bitcoin #digitalcurrency

#globaleconomy #cryptoprediction

Ethereum Price Prediction: ETH/USD Hovers at Lower Range-zone


Hovers at Lower Range-zone – June 9
The lower range-zone of $2,500 is still relevant in the ETH/USD trade valuation as the crypto’s worth continually hovering around it. Price is now trading around the $2,518 level at an about 0.34 percent increase.

Hovers at Lower Range-zone: ETH Market
Key Levels:
Resistance levels: $3,000, $3,500, $4,000
Support levels: $2,300, $2,000, $1,700

ETH/USD – Daily Chart

It still appears on the ETH/USD daily chart that the crypto-economy hovers around the lower range-zone of $2,500 that has over the time being kept. The bigger SMA is placed at the point to indicate it as the main determining directional move of the next definite price direction.

The 14-day SMA trend-line is located in the range-bound zones pointing toward the east as the bearish trend-line drew slightly across it to the south. It is equally noted that the 50-day SMA indicator is positioned underneath them also points toward the east direction. The Stochastic Oscillators have crossed from the overbought region pointing to the south a bit over range 40. By that, it could be that more downs are in the offing at a later session.

How long will it be, as ETH/USD market hovers at the lower range-zone?

It seems not easily projected as to how long will the market operations between Ethereum and the US Dollar hover at the lower range-zone of $2,500. Nevertheless, active price action will determine that in the process of a sudden emergence in the crypto market. In the meantime, bulls may find an entry around the bigger SMA indicator while a rebound is visibly from its side of the sell signal line.

As regards the downside continuation of this trade, a sustainable of breaking downward at the lower range-zone is much needed to allow bears to have a better nudge of southward pushes. Interception of the bigger SMA from the top by the smaller SMA isn’t most likely achievable in the near time to be able to add more confirmation to the longevity of a presumed downward force’s returning in the market.

ETH/BTC Price Analysis

Ethereum’s market valuation appears to have trended on a higher note in comparison with the flagship crypto popularly known as Bitcoin. The price analysis chart presently depicts the market trending situation as slightly beginning to see a downsize in the base crypto’s weight pairing with the counter trading instrument.

All the SMAs are located below the trending zone as the 14-day SMA is over the 50-day SMA indicator. And, the bullish trend-line drew between them as well to indicate a northward direction.

The Stochastic Oscillators have slightly crossed the lines in the overbought region pointing southbound near range 80 to suggest that the base crypto is on the verge of losing back the trending weight to its counter trading tool possibly in the near session.

#bitcoin #digitaleconomy

#globaleconomy